Figure 4.

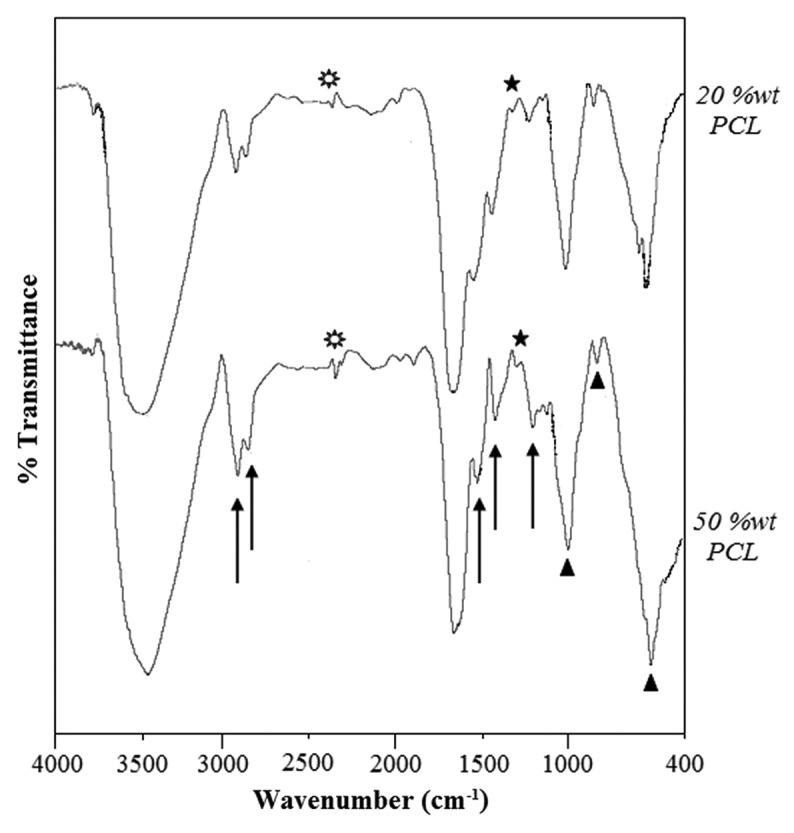
The FTIR spectra of the nanocomposite samples with 20%wt PCL (top) and 50%wt PCL (bottom), [triangles, Hap; stars, 1345 (cm−1) related to the gelatin-HAp bond; sunburst, 2363 (cm−1) related to the cross-linking process].

The FTIR spectra of the nanocomposite samples with 20%wt PCL (top) and 50%wt PCL (bottom), [triangles, Hap; stars, 1345 (cm−1) related to the gelatin-HAp bond; sunburst, 2363 (cm−1) related to the cross-linking process].