Figure 7.
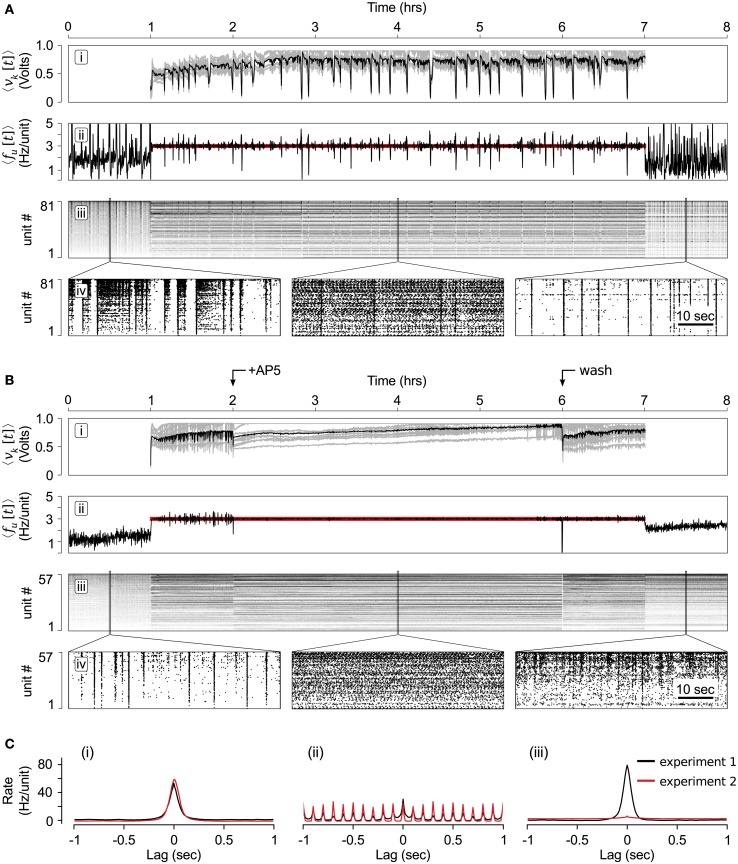
Long-term population clamp. (A) (i) The mean stimulation voltage (black) and individual electrode stimulation voltages (gray) over the course of the 6-h clamping protocol. (ii) The neuronal firing rate (black) compared to the target rate (red line). (iii) Individual unit firing rates, sorted in order of increasing rate during the 1 h period prior to the start of closed-loop control. (iv) Zoomed rastergrams showing short time scale network spiking before, during and after the controller was engaged. (B) Same as (A) except that AP5 was added 1 h after the start of the closed-loop controller and removed 4 h later. This is indicated by the arrows at the top of the figure. (C) Average pair-wise correlation functions between units for experiments with and without AP5 application (red and black lines, respectively). Cross-correlations were created from spiking data (i) during spontaneous activity before the closed-loop controller was engaged, (ii) half-way through the closed-loop-control period, and (iii) during spontaneous network activity following closed-loop control. The data used to create the correlation functions is centered about locations used to create the rastergrams shown in (Aiv) and (Biv). To create the correlation functions, unit firing rates were calculated using 10 ms time bins.

