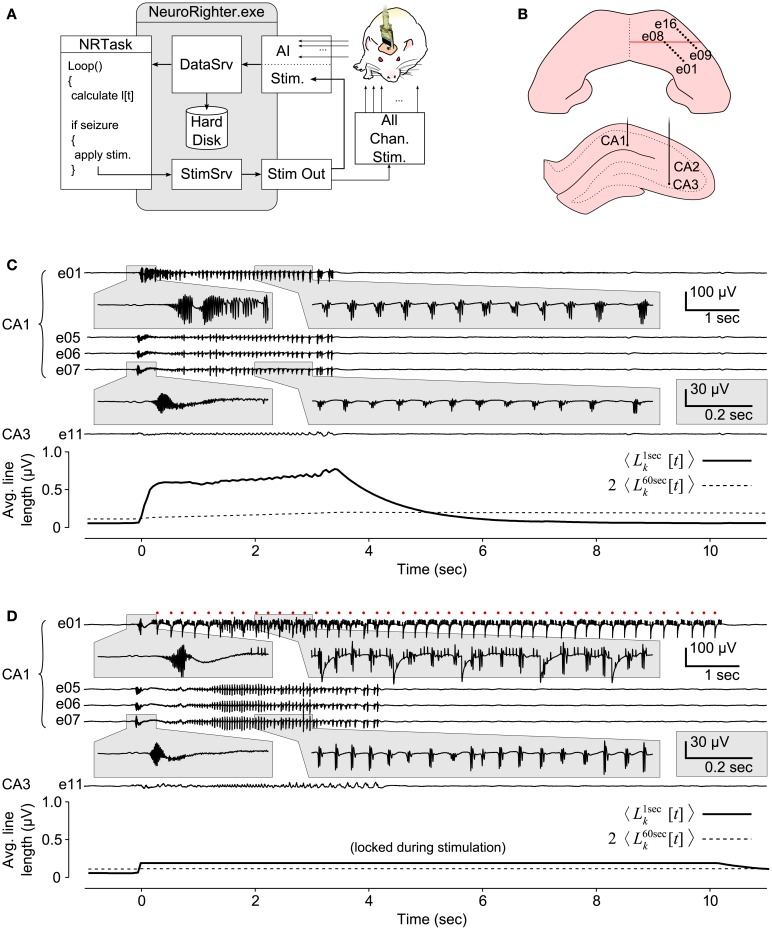
Figure 8.
Closed-loop seizure intervention in a freely moving rat. (A) Schematic of the closed-loop seizure intervention protocol. A 16-channel microwire array, with two rows of 8 electrodes, were used to record LFP signals in the CA1 and CA3 regions of the hippocampus of a epileptic rat. Paroxysmal activity in CA1 triggered the application of multichannel electrical stimulation through the recording electrodes via a stimulation multiplexing board (green). (B) Implantation sites of the microwire array. Top view shows the electrode penetration sites (black dots) in the right-dorsal hippocampus. The red line indicates position of the coronal view shown below. (C) A 12 s epoch of hippocampal LFPs during a seizure event. Electrodes 1–8 were located in CA1 and 9-16 in CA3. The line length measures, averaged across channels, are shown below the LFP traces. Seizure detection occurs at 0 s. (D) Same as (C) except with closed-loop stimulation engaged. Electrical stimulation was applied on electrode 1 along with nine other electrodes (not shown). Red dots indicate stimulation times for e01 and stimulation artifacts appear on the LFP trace. e05–e07 and e11 were not used for stimulus application.

