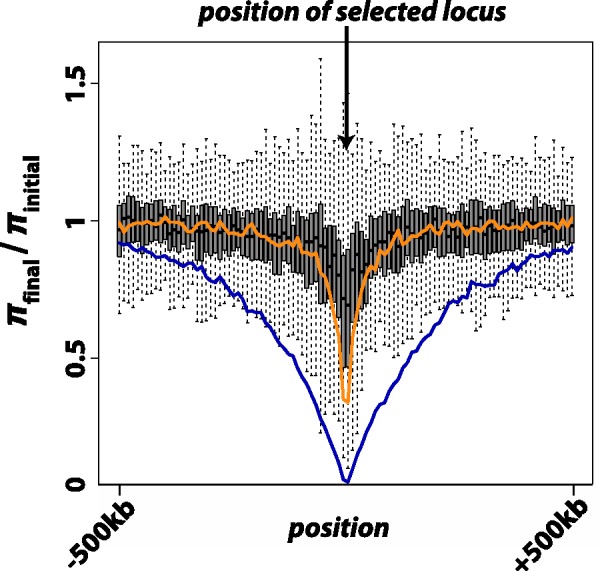
Fig. 6.

Results from 250 independent simulations each of additive selection on a microsatellite, a soft sweep (p0 on the interval [0.1, 0.2]), or a hard sweep ( ), where p0 is the starting frequency of the beneficial SNP variant. The y-axis plots
  , where final nucleotide diversity (
 ) was calculated from a sample of n = 100 chromosomes either at the time of fixation of the beneficial variant (SNP selection) or when mutation-selection-drift equilibrium was achieved (microsatellite selection). In all selection scenarios, the target of selection was located at the center of a 1 Mb sequence. Box plots summarize the results from simulations of microsatellite selection in non-overlapping 10 kb windows (rectangles are interquartile distances). Colored lines plot the mean value of
  across simulations for soft sweep (orange) and hard sweep (blue) simulations.
