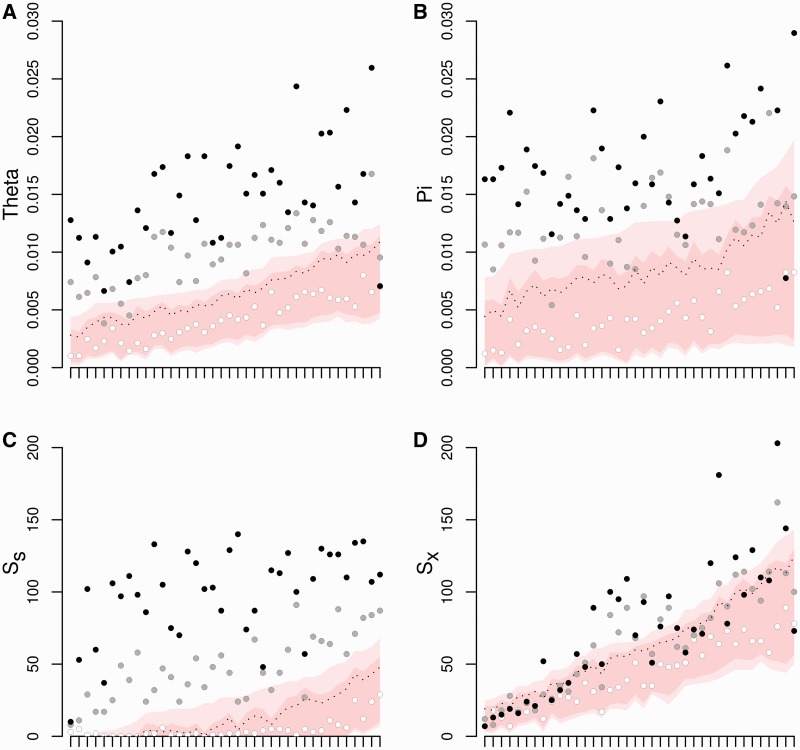
Fig. 2.
Results of the validation procedure for the approach used to detect excess polymorphism in a neutral locus partially linked to a balanced polymorphism. Red and pink areas, respectively, represent the 95% and 99% limits of the expected neutral distributions obtained by coalescent simulations from ABC’s joint posteriors for: (A) Watterson's θw per bp, (B) π per bp, (C) the number of shared, and (D) exclusive polymorphic sites. The x axis represents the different replicates of the validation procedure with different demographic parameters, sorted in ascending order of the 99.5% quantile. White, gray, and black dots represent observed values of the statistics computed at the neutral locus at increasing recombination distance (ρ = 0.5, ρ = 0.001, and ρ = 0.0001, respectively). The dotted lines represent the thresholds above which any value of the statistic is considered as a deviation from neutrality.

