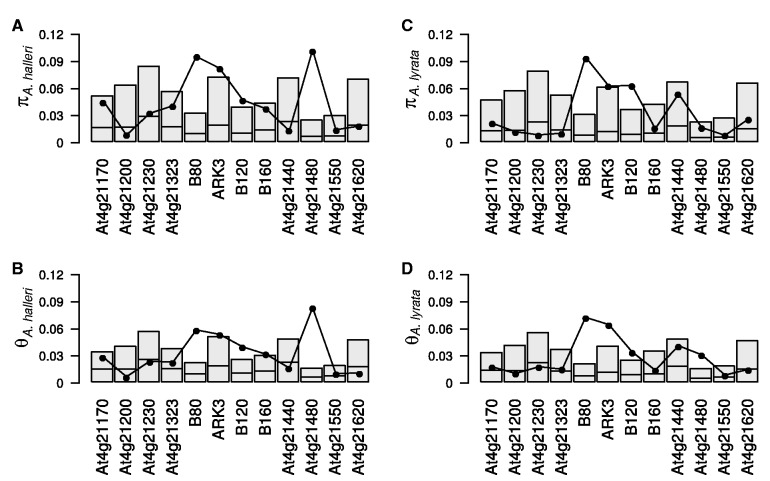
Fig. 3.
Histograms of the observed synonymous diversity measures per base pair for the 12 S-locus flanking genes in Arabidopsis halleri (A and B) and A. lyrata (C and D) and their expected distribution obtained from coalescent simulations under the null hypothesis of no linkage to selected sites. Synonymous polymorphism was estimated by both the nucleotide diversity π (A and C) and Watterson's θw (B and D). Shaded boxes indicate the one-tailed 95% confidence intervals for each locus, obtained by simulations. Solid dots indicate the observed values. Thick horizontal lines indicate the median of each distribution.

