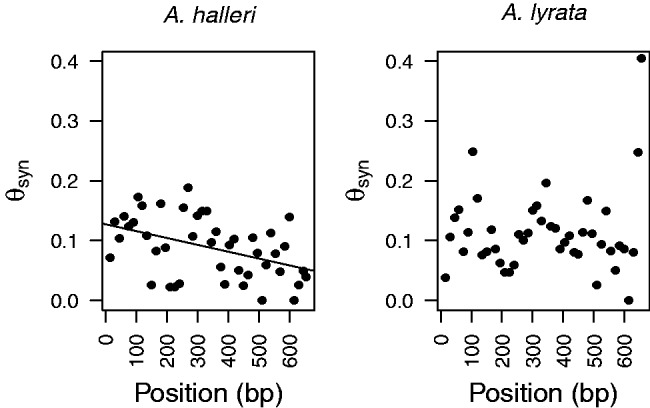
Fig. 4.

Sliding window analysis of synonymous polymorphism measured by θw (expressed per bp) within the B80 flanking gene in (A) Arabidopsis halleri and (B) A. lyrata. The x axis is the nucleotide position (in bp) relative to the closest nucleotide from the S-locus in the sequenced fragment. Regression line is only shown for A. halleri (R = −0.4340) because the estimated measure of association was significant after a permutation test (P = 0.0025), while not for A. lyrata (R = 0.1113).
