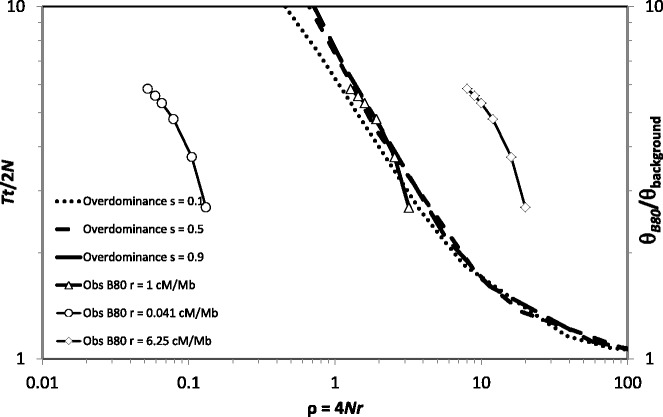
Fig. 6.
Comparison between observed versus expected patterns of diversity peaks for neutral sites partially linked to a locus subject to balancing selection. Dotted and interrupted lines represent expected values under overdominant selection with different selection intensities. Continuous lines represent observed values for the B80 flanking gene in Arabidopsis halleri with different values assumed for the per nucleotide recombination rate in the flanking region.

