Fig. 7.

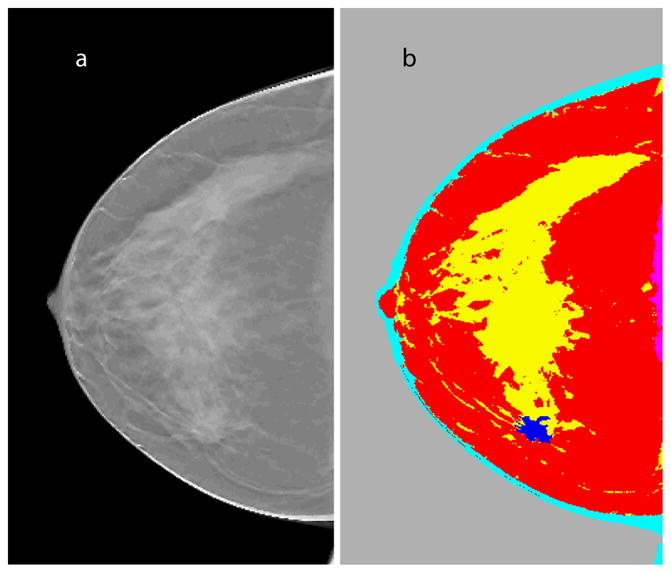
a. Representative slice (x-y plane) from DBT reconstruction that prominently shows the lesion; b. segmented slice color-coded to represent skin (cyan), adipose (red), fibroglandular (yellow), muscle (magenta), and lesion (blue).

a. Representative slice (x-y plane) from DBT reconstruction that prominently shows the lesion; b. segmented slice color-coded to represent skin (cyan), adipose (red), fibroglandular (yellow), muscle (magenta), and lesion (blue).