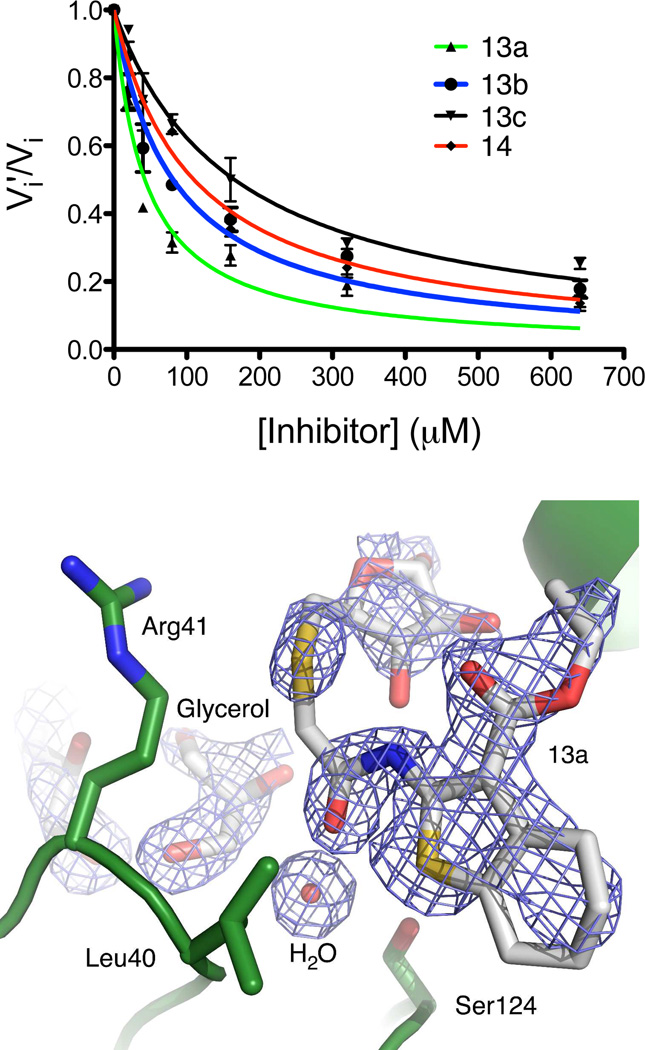
Figure 5.
Inhibition of Ag85C. A) vi’ represents the initial velocity of the inhibited enzymatic reaction at the respective inhibitor concentration. vi represents the initial velocity of the uninhibited enzymatic reaction. B) The enzyme active site is shown (with green carbon atoms) with one molecule of 13a, one water molecule, and two molecules of glycerol (molecules with gray carbon atoms). The placement of these compounds was based on the Fo-Fc omit maps (light blue difference density) shown contoured at 3σ. Colors for the atoms other than carbon are blue, red, and yellow for nitrogen, oxygen, and sulfur, respectively.

