
Figure 1.
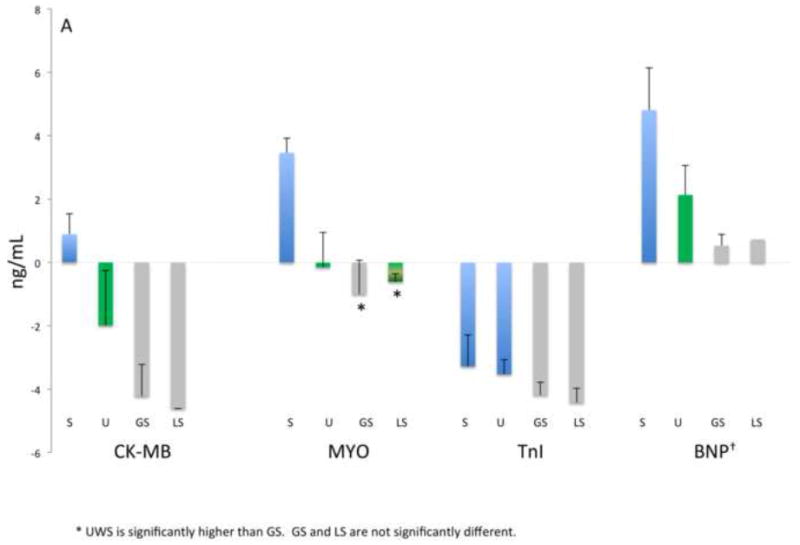
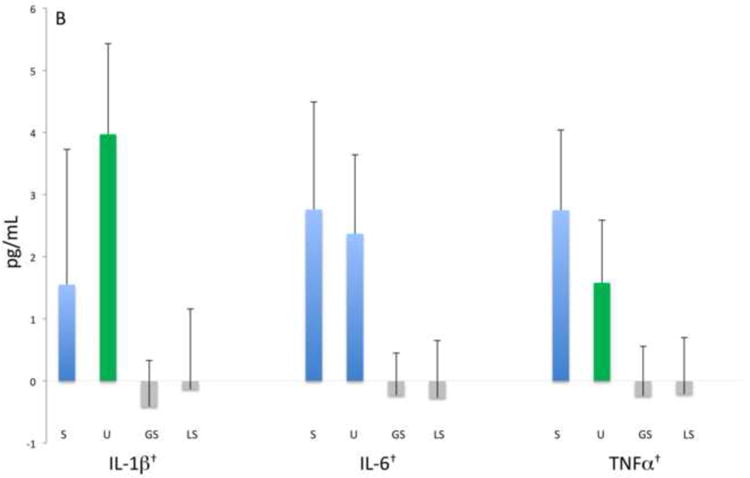
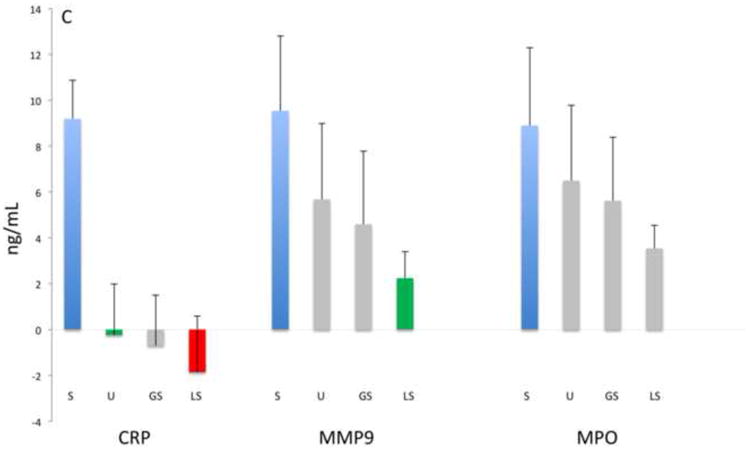
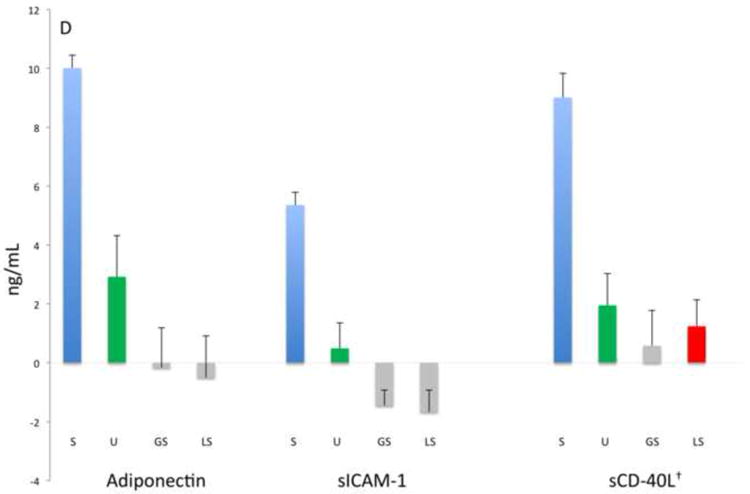
Analyte concentrations by fluid category and biomarker groups: A) Myocardial damage, B) inflammation-associated, C) acute phase protein and proteinases, D) lipid metabolism and atherosclerosis. Bars represent mean values (ng/mL, natural log) and mean standard errors for the entire study population except for BNP, IL-1β, IL-6, TNFα, sCD40-L that are pg/mL as indicated with †. Significant differences between concentrations (p<0.05) are indicated by different colored bars as determined by t-test.