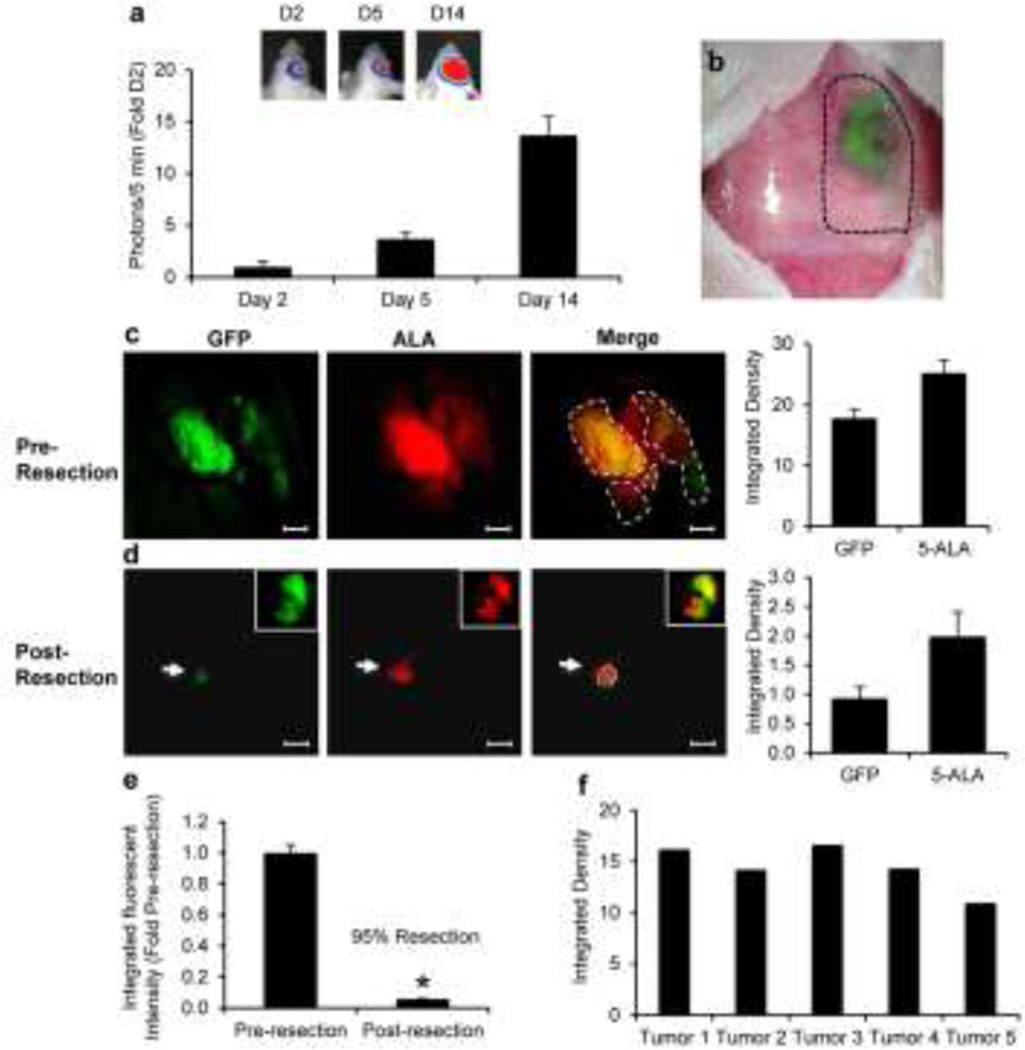
Figure 1. Fluorescence-guided GBM resection and validation by 5-ALA.
(a) Representative images and summary data showing the progression of orthotopic U87 human GBM in mice by BLI. (b) Representative image revealing the location of the U87-GFP-FLuc tumor visualized through the cranium. The borders of the cranial window were determined based on the fluorescent signature of the established tumor (depicted by dashed line). The craniotomy was then created to expose the underlying tumor. (c-d) Representative intra-operative fluorescent images of GFP-Fluc-expressing intracranial human GBM and validation by 5-ALA pre- (c) and post- (d) tumor resection. Insets depict GFP fluorescence, 5-ALA, or merged signal from excised tissue. Summary graphs demonstrating relative intracranial pre- and post- resection tumor volumes determined by GFP or 5-ALA imaging are shown. Dashed line shows area of co-localization between GFP and 5-ALA. (e) Summary graph demonstrating the extent of surgical resection determined by GFP fluorescence imaging. (f) Summary data showing the relative size of tumor tissue removed during surgical resection determined by GFP fluorescence imaging. Data are mean±SD, *P<0.05 determined by Students T test. Scale bars, 200 µm.

