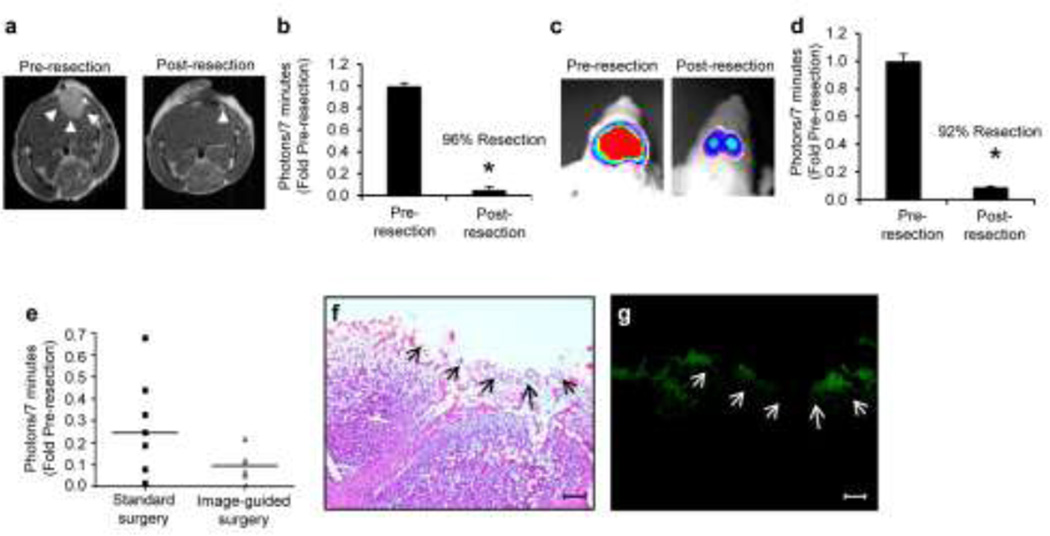
Figure 2. Quantitative non-invasive imaging of GBM volumes pre- and post-resection.
Representative images and summary data of quantitative imaging showing the extent of surgical resection by MRI (a-b) and BLI (c-d). MRI: one day before resection and one day post-resection, mice underwent MRI imaging following intravenous injection of Gd-DTPA. Tumor volumes were determined using Image J analysis software. Arrows indicate tumor deposits. BLI: one day before resection and one day post-resection, tumor volumes were assessed by injecting mice with D-luciferin and photon emission was determine over 7 minutes. (e) Scatter plot showing residual tumor volumes determined by BLI following image-guided resection or standard non-guided surgery. Horizontal bar shows mean of each surgery type. (f-g) Representative white light H&E images (f) and fluorescent photomicrographs (g) of corresponding brain sections post-resection (day 1). Arrows in f and g indicate extent of resection of the tumor. Data are mean±SD, *P<0.05 determined by Students T test. Scale bars, 100 µm (f,g).

