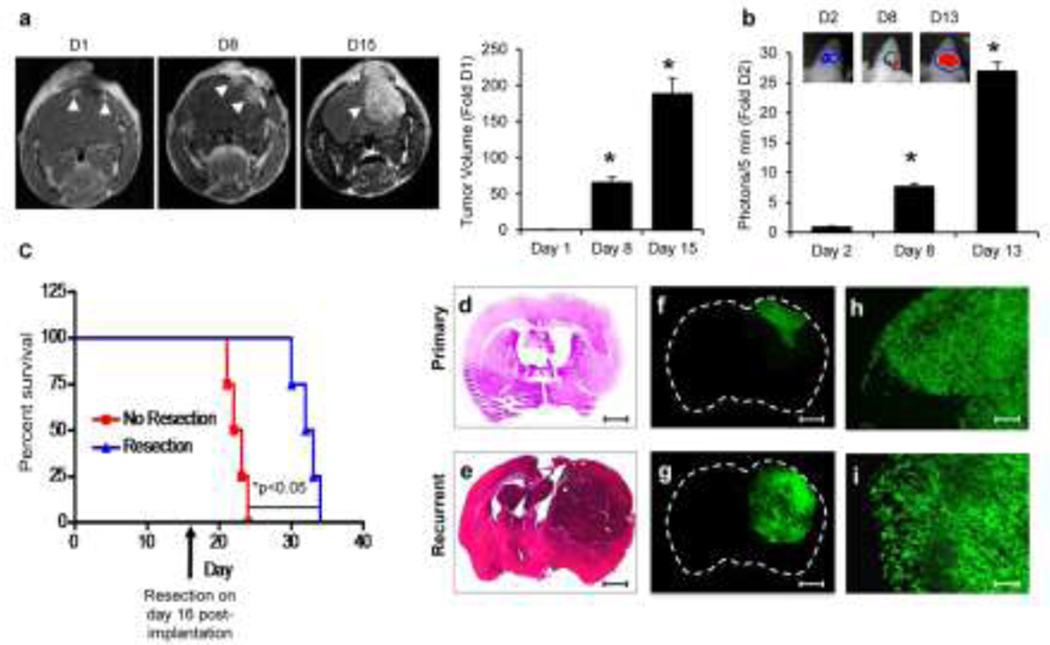
Figure 3. Multi-modality tracking of post-operative GBM recurrence.
(a-b) Representative images and summary graphs showing the recurrence of GBMs following surgical resection by noninvasive imaging. Following surgical debulking, mice were subjected to MRI on days 1, 8, and 15 post-resection (a) or BLI on day 2, 8, and 13 post-resection (b). Arrows indicate tumor deposits in panel (a). (c) Kaplan-meier curves depicting the survival of control without surgical resection or mice that underwent tumor debulking. (d-i) Representative white light H&E images (d,e) and fluorescent photomicrographs (f-i) of brain sections from primary tumor bearing mice (d,f,h) and from mice with recurrent tumors 2 weeks post-resection (e,g,i). Following intracranial xenograft, mice were sacrificed 2 weeks post-implantation, or underwent surgical debulking and sacrificed 2 week post-surgery to visualize tumor recurrence. 2× magnification-d,e,f,g; 10× magnification-h,i. Data are mean±SD, *P<0.05 determined by ANOVA (panel a,b), and log rank test (panel c). Scale bars, 100 µm (d,e,f,g) and 400 µm (h,i).

