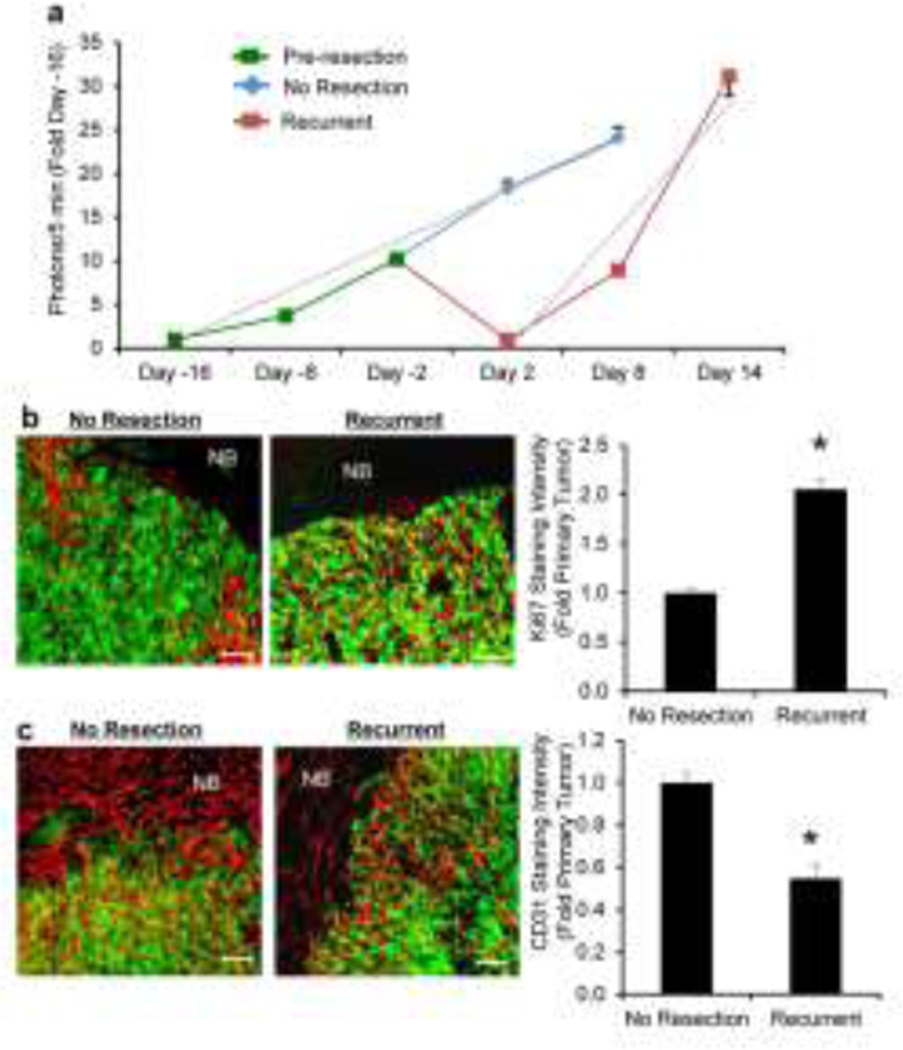
Figure 4. Resected GBMs show higher growth rates than non-resected GBMs.
(a) Summary graph showing the growth rates of primary or recurrent intracranial GBM determined by BLI. Dotted line shows the slope of the GBM growth curves for each group determined by regression analysis. (b-c) Representative images and summary data showing the relative expression levels of the proliferation marker Ki67 (b) and blood vessel marker CD-31 (c) in tissue sections from primary or recurrent GBM. Data are mean±SD, *P<0.05 determined by Students T test (panel b,c). Scale bars, 100 µm.

