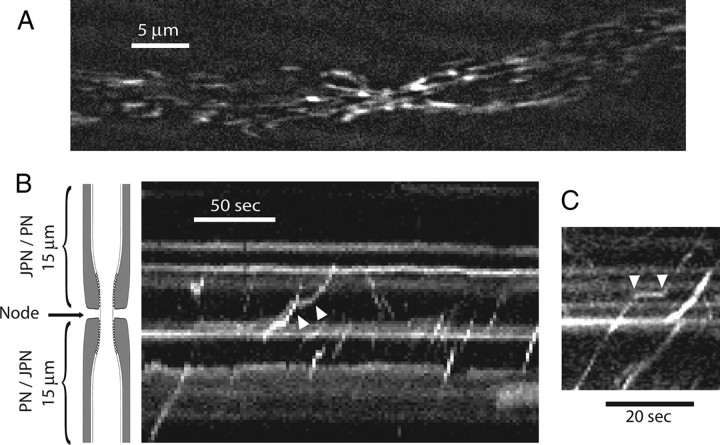
Figure 4.
Kymographs of mitochondrial motility. A, Still fluorescent image of MitoTracker-labeled mitochondria in the axon of a single myelinated fiber. The node is near the center where the axon shows a conspicuous constriction (supplemental Movie 1, available at www.jneurosci.org as supplemental material). B, C, Representative kymographs showing anterograde movement (positive slope), retrograde movement (negative slope), and pauses (between white arrowheads). The schematic drawing of myelinated axon applies to B and C. Note the position of the node and the flanking paranodes (PN) and juxtaparanode (JPN).

