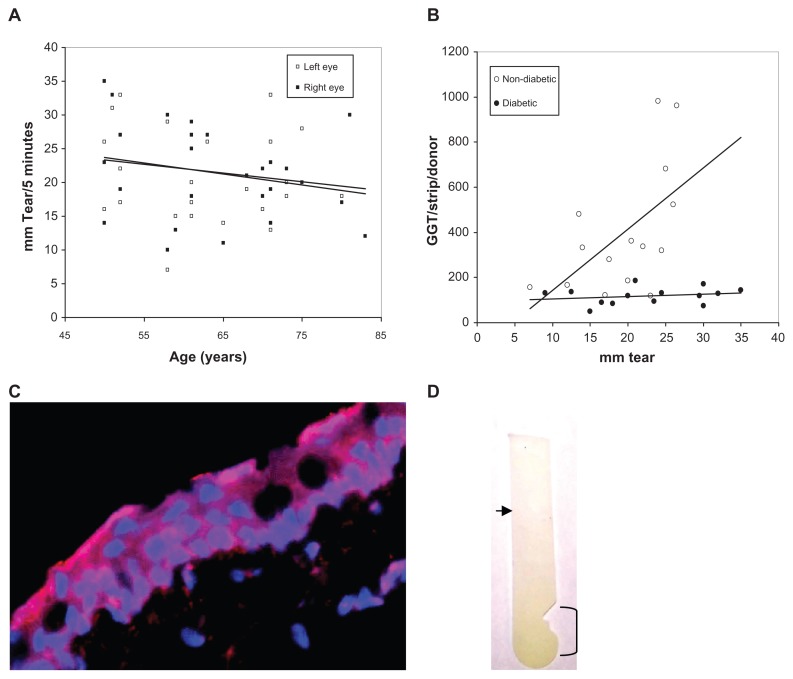
Figure 5.
(A) Scatter graph plot of the bilateral Schirmer tear production of all adult donors versus age showing a general decline in tear production (left and right trend lines) with donor age. (B) Scatter graph plot with trend line (linear regression) of tear volume (mm) per Schirmer test strip versus GGT activity per Schirmer test strip for non-diabetic and diabetic tear donors. (C) Distribution of GGT (red) on DAPI-stained (blue nuclei) human conjunctival epithelial cells (×400). (D) GGT reaction substrate (yellow color) was concentrated on the Schirmer’s test strip in the conjunctival contact area (bracket) and decreased toward the tear meniscus (arrow).
Abbreviation: GGT, γ-glutamyl transpeptidase.

