
Figure 4.
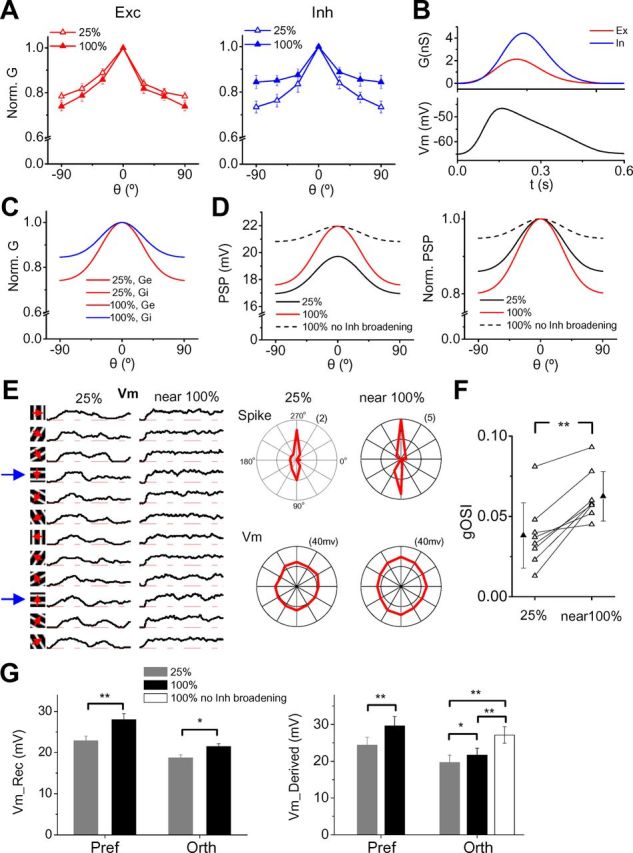
A broadening of inhibitory tuning primarily contributes to the contrast-dependent sharpening of OS. A, Average normalized excitatory and inhibitory tuning curves at the two different contrasts (25% and near 100%). Bar, SE; n = 14. B, Top, Simulated excitatory and inhibitory synaptic conductance waveforms (1 cycle). Bottom, Membrane potential response generated by the integrate-and-fire neuron model when the evoked synaptic conductances shown on top were integrated. C, Tuning profiles of excitation and inhibition at 25 and 100% contrast applied in our model. Ge, excitation. Gi, inhibition. D, Tuning curves of PSP generated by our model. Black, 25% contrast. Red, 100% contrast. Dash, 100% contrast but with the inhibitory tuning profile prevented from broadening (i.e., it is the same as the one at 25% contrast). The applied strength of synaptic conductance at different contrasts was according to the tuning curve shown in C. Right, Normalized PSP tuning curves. E, Left, Average subthreshold Vm responses of an example cell recorded under the current-clamp mode. Spikes were removed by a 15 ms median filter before averaging. Each trace is 1.5 s. Right, Polar graphs of evoke spike rate and peak depolarization voltage. F, gOSI of peak Vm response at 25% and near 100% contrast. Data points for the same cell are connected with a line. **p < 0.01, paired t test; n = 8. G, Left, Average peak Vm responses at the preferred and orthogonal orientations from our current-clamp recording results. n = 8. Right, Vm responses derived by feeding the experimentally determined excitatory and inhibitory conductances into the neuron model. White column represents the Vm response generated when the inhibitory tuning was prevented from broadening (i.e., the recorded inhibitory responses at near 100% contrast are scaled according to the average inhibitory tuning curve at 25% contrast). *p < 0.05; **p < 0.01, paired t test. n = 14.