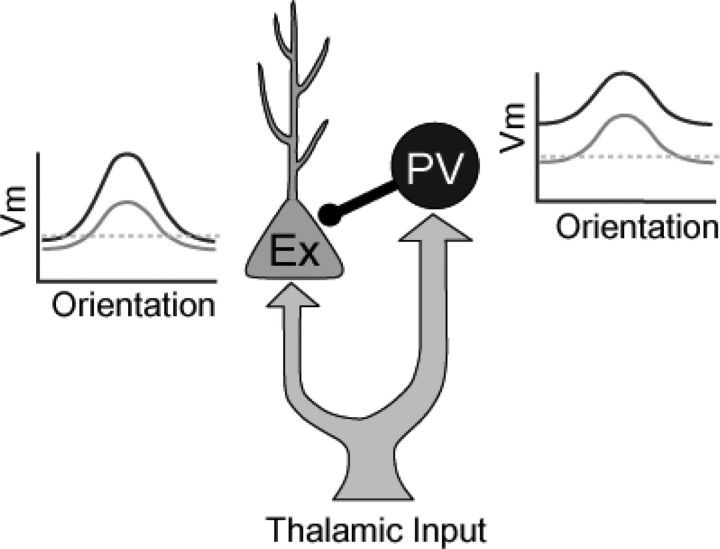
Figure 7.
A simple model for contrast invariance of excitatory neurons and contrast variance of PV inhibitory neurons. The schematic orientation tuning curves of Vm response for the PV neuron(s) and the excitatory (Ex) cell are shown. Gray, At a low contrast. Black, At a high contrast. Dotted gray line, Spike threshold. The PV neuron(s) exhibits a similar preferred orientation as the excitatory cell, since they receive a similar set of thalamic inputs.

