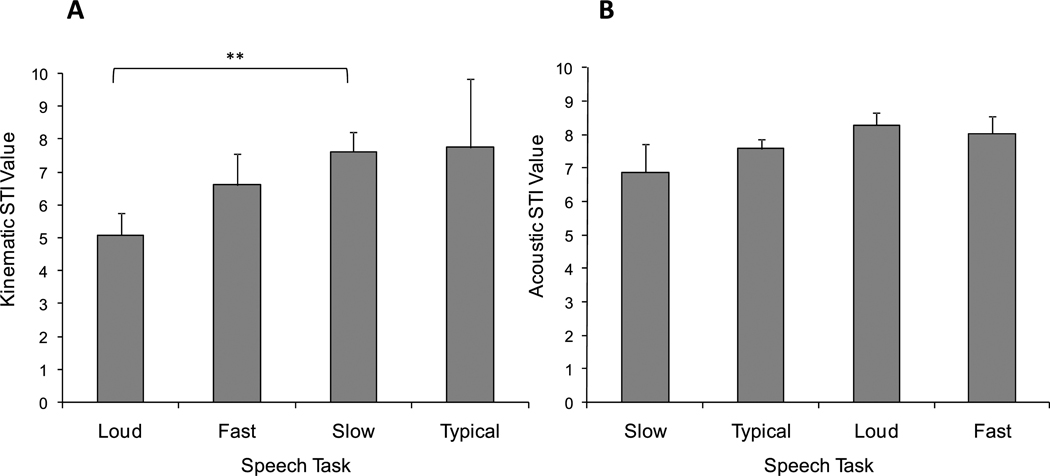
Figure 10.
Speech task effects for phonetic variability. Panel A displays the mean of the kinematic spatiotemporal index (STI) values (+ SE) for each speech task (N = 10). The tasks are shown in ascending order with the lowest STI value on the left side. The mean acoustic STI values (+ SE) for each speech task (N = 10) are shown in Panel B. **p < .01.

