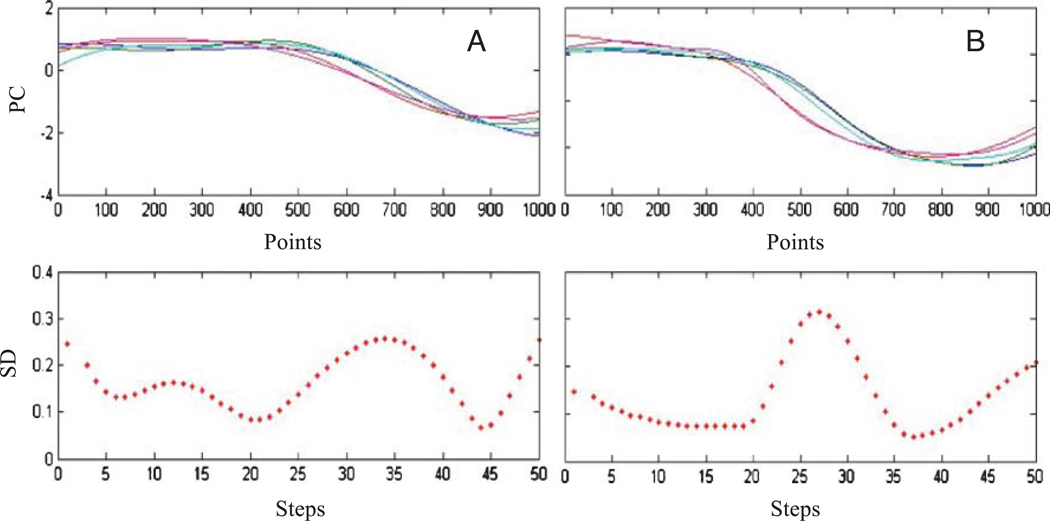
Figure 6.
Determining phonetic variability. Panel A: Kinematic variability. The time- and amplitude-normalized principal component of the three-dimensional tongue movement is plotted for each repetition of /ia/. The SD within a 20-point window is plotted below the movement traces. Panel B: Acoustic variability. The time- and amplitude-normalized principal component of the first and second formant movement is plotted for each repetitions of /ia/. The SD within a 20-point window is plotted below the formant movement traces.

