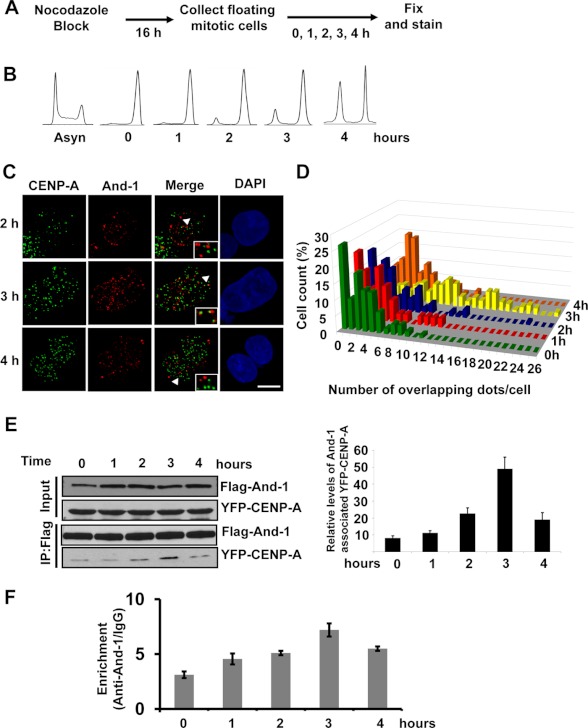
FIGURE 6.
And-1 associates with CENP-A when cells transit from mitosis to G1 phase. A, schematic showing synchronization of cells in mitosis and release into late mitosis and early G1 phases. B, FACS analysis of cells harvested as in A. C, localization of And-1 with CENP-A in late mitosis and early G1 phase. Representative images show And-1 (red) and CENP-A (green) localization in HCT116 cells during late telophase/early G1 phase. Insets are enlarged images of co-localization indicated by arrowheads. Cells were preextracted with 0.3% Triton X-100. D, quantification of cells with And-1 and CENP-A overlapping or adjacent signals in HCT116 cells for each time point evaluated after release into G1 (n = 60–150 cells for each time point). E, interaction between And-1 and CENP-A during late telophase/early G1 phase. Left, chromatin-free extracts from 293T cells co-transfected with FLAG-And-1 and YFP-CENP-A treated as in A, followed by immunoprecipitation with anti-FLAG and immunoblotting with antibodies as indicated. Right, quantification of FLAG-And-1-associated YFP-CENP-A as in left panel. The signals of FLAG-And-1-associated YFP-CENP-A and FLAG-And-1 immunoprecipitations (IP) were quantified by Scion imaging software, and the relative levels of And-1-associated YFP-CENP-A are YFP-CENP-A signal-normalized by FLAG-And-1 immunoprecipitation signals. Data represent the mean ± S.D. (error bars) from three independent experiments. F, enrichment of And-1 at α-satellite repeat (Satα) region. Cells treated as in A were harvested for ChIP assay as in Fig. 3B. y-axis represents the relative enrichment of the And-1 proteins at the α-satellite repeat region at centromere compared with the IgG control (after normalization with input precipitations, data ± S.D., n = 3).

