
FIGURE 6.
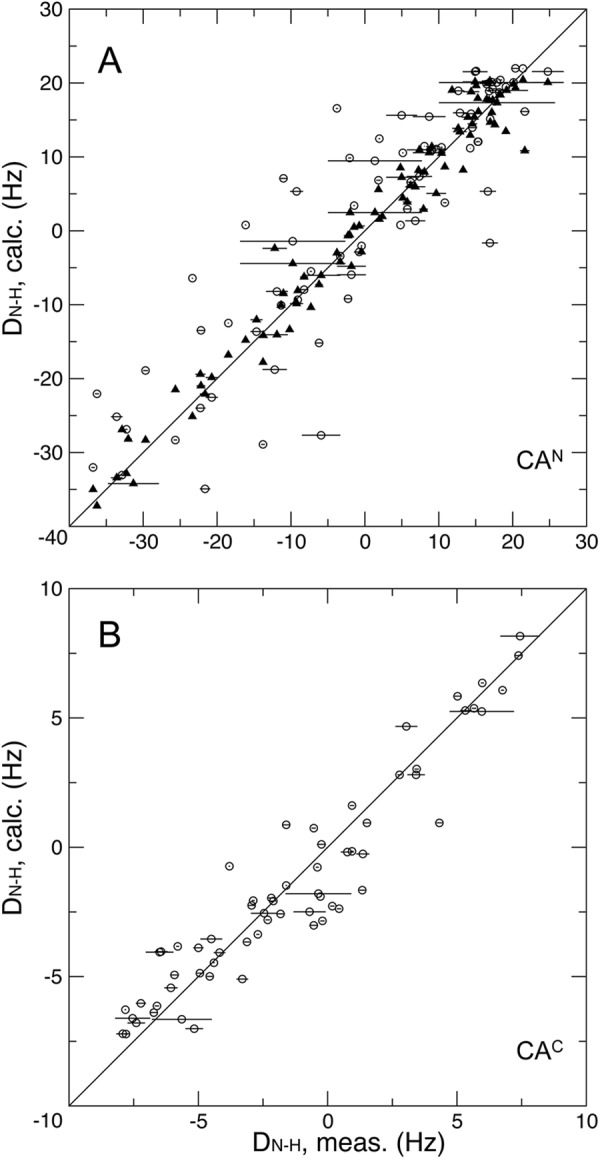
The correlation between the measured backbone 1H-15N RDCs and calculated values for domains CAN (A) and CAC (B) of the wt EIAV-CA at pH 6.7. The circles are fits using the crystal structure coordinate. The triangles are the fits using the refined CAN domain coordinates.