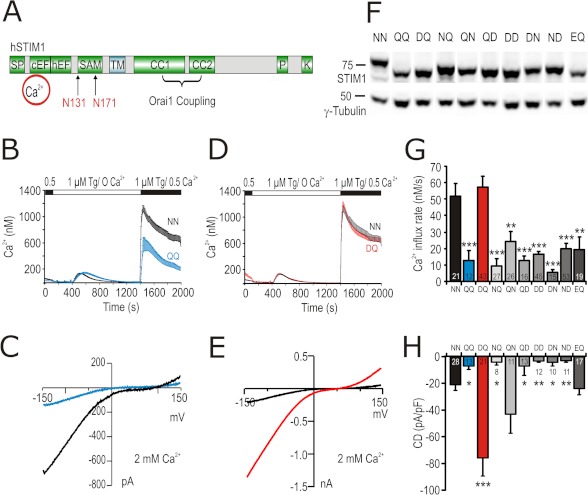
FIGURE 1.
Mutations in STIM1 N-glycosylation sites modulate ICRAC. A, schematic representation of structural domains in STIM1 protein showing the two N-glycosylation sites (Asn-131 and Asn-171) within the luminal EF-SAM domain. SF, signal peptide; cEF, canonical EF-hand Ca2+-binding region; hEF, hidden EF-hand Ca2+-binding region; TM, transmembrane domain; CC1 and CC2, coiled-coil regions; P, proline-rich domain; K, lysine-rich domain. B, average [Ca2+]i responses before and following store depletion by the addition of 1 μm Tg and readdition of indicated [Ca2+]o (SOCE) in cells co-transfected with Orai1 and STIM1 WT (NN, black trace) or STIM1 N131Q/N171Q (QQ, blue trace). C, exemplary current-voltage (I/V) plot of ICRAC from whole cell recordings in cells transfected as in B. D, SOCE of cells expressing Orai1 and STIM1 WT (NN, black trace) or STIM1 N131D/N171Q (DQ, red trace). E, exemplary (I/V) plot of ICRAC from whole cell recordings in cells transfected as in D. F, immune blot of total cell lysates from cells expressing Orai1 and STIM1 WT or the corresponding mutant indicated above the blot. Letters stand for single amino acid codes at positions 131 and 171, respectively. G, average of Ca2+ influx rates obtained from SOCE measurements in cells transfected as in F. H, CD extracted at 110 s and −140 mV from whole cell recordings in cells transfected as in F.

