FIGURE 3.
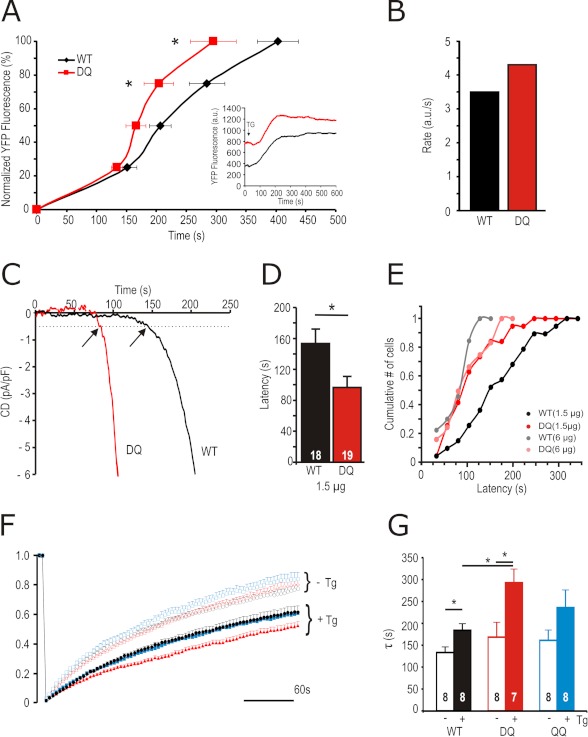
STIM1 DQ shows faster translocation to PM, activation kinetics, and altered diffusion following stimulation. A, traces of normalized (% of maximum) YFP fluorescence at the TIRF plane over time in cells expressing YFP-STIM1 WT (black) or STIM1 DQ (red) and Orai1-RFP. The inset shows the absolute change in fluorescence over time. B, rate of increase of YFP-fluorescence in cells measured in A, as calculated from fitting the averaged traces with a Hill function. C, exemplary traces showing kinetics of current development initiated by passive depletion in cells expressing Orai1 and STIM1 WT (black) or STIM1 DQ (red). The arrows indicate latencies defined as the time point when current size reaches 0.5 pA/pF. D, average latencies of STIM1 WT (black) and STIM1 DQ (red) measured in C. E, cumulative number of cells activated within time segments of 25 s obtained from recordings from cells transfected as in C or with 6 μg of STIM1 WT (gray) or STIM1 DQ (pink). F, traces showing YFP-STIM1 fluorescence recovery after photobleaching over time in cells expressing YFP-STIM1 WT (black circles), STIM1 DQ (red triangles), or STIM1 QQ (blue squares) with (closed) or without (open) pretreatment with Tg (see “Experimental Procedures” for analysis). G, average time constants (τ) of YFP fluorescence recovery from cells measured in F.

