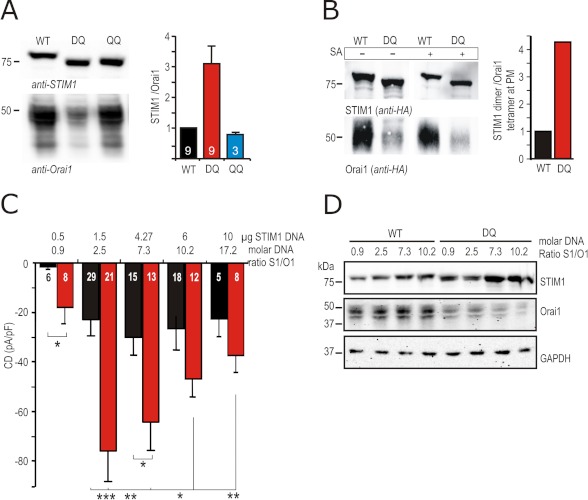
FIGURE 4.
STIM1 DQ mutant down-regulates Orai1 protein and expression of different STIM1:Orai1 DNA ratios cannot mimic the STIM1 DQ phenotype. A, left panel, immune blot of lysates of cells expressing Orai1 and STIM1 WT/DQ/QQ. Detection with anti-STIM1 or anti-Orai1 antibodies. The right panel represents the quantification of STIM1 to Orai1 protein ratios obtained from several experiments, each normalized to the WT ratio of the corresponding experiment. B, left panel, immune blot of surface expressed (biotinylated) proteins in HEK cells expressing HA-tagged Orai1 and STIM1 WT or STIM1 DQ. 50 μg of protein (5% of total) was loaded in lanes 1 and 2; lanes 3 and 4 show the entire SA-retained fraction. Detection was done with anti-HA antibody. The quantification shown in the right panel was done as follows: (total input STIM1 a.u./2)/(SA retained Orai1 a.u./4). The ratio of STIM1 DQ was normalized to WT. C, CD measured and extracted as in Fig. 1H from cells transfected with 0.5 μg of Orai1 and different DNA amounts of STIM1 (μg of STIM1) WT (black) or STIM1 DQ (red) at molar ratios shown above the bar graphs. D, immune blot of lysates of cells transfected as in C; detection with anti-STIM1, anti-Orai1, and anti-GAPDH antibodies.

