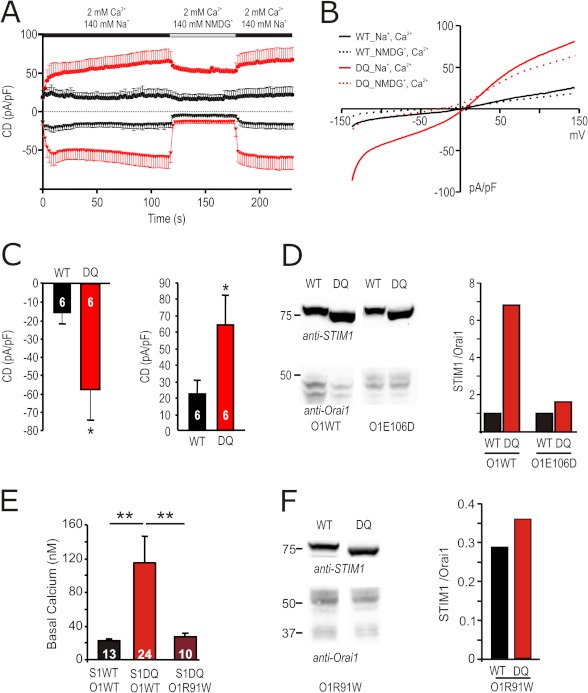
FIGURE 5.
The Orai1 pore mutant E106D is amplified by, but largely protected against, STIM1 DQ-induced degradation. A, traces showing average CD over time recorded from cells transfected with 0.5 μg of Orai1 E106D and 1.5 μg of STIM1 WT (black) or STIM1 DQ (red) extracted at +120 and −140 mV. External solution was changed as shown in the bar above the traces. B, corresponding I/V plots from cells measured in A, extracted in Na+-containing (110 s, solid lines) and NMDG-containing (140 s, dotted lines) solution. C, CD in cells recorded in A, extracted in the Na+-containing solution after 110 s at −140 mV (left panel) or +120 mV (right panel). D, immune blot of lysates of cells transfected as in A or with 0.5 μg of Orai1WT together with 1.5 μg of STIM1WT or STIM1 DQ (left panel). Detection was done with the indicated antibodies, and STIM1/Orai1 protein ratios are quantified in the right panel. E, basal [Ca2+]i in cells transfected either with 0.5 μg of Orai1 WT or Orai1 R91W and 1.5 μg of STIM1 WT or STIM1 DQ as indicated below ([Ca2+]o 2 mm). F, immune blot of lysates of cells transfected as in E. Detection was done with the indicated antibodies, and STIM1/Orai1 protein ratios are quantified in the right panel.

