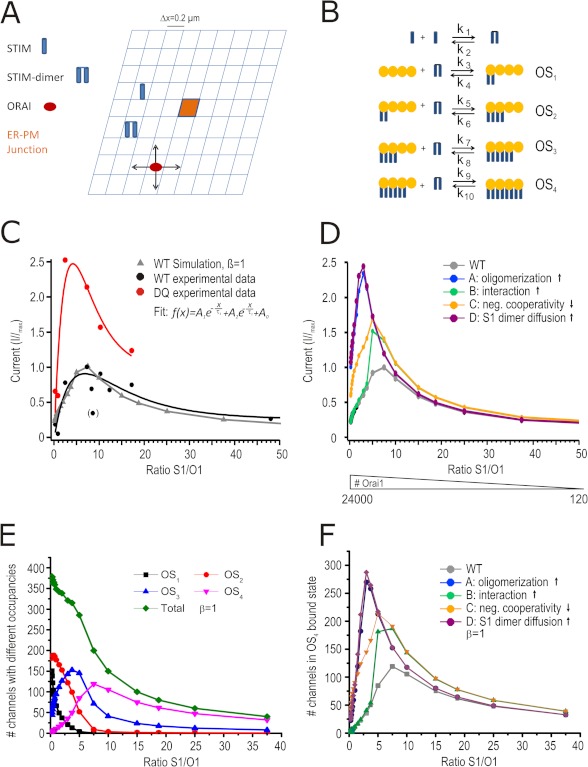
FIGURE 6.
STIM1 DQ phenotype can be simulated by a mathematical model. A, model geometry. The size of ER-PM junction is (0.2 μm)2. B, reaction scheme where OS(x) denotes one Orai1 tetramer with (x) STIM1 dimer bound with the corresponding reaction constants shown above the arrows. C, normalized stationary CD plotted against the STIM1/Orai1 ratio for measured STIM1 WT (black circles) and modeled (simulated) WT data (gray triangles) and for measured STIM1 DQ (red) normalized to measured WT maximum. D, normalized currents derived from the model plotted against S1/O1 ratio. The colors denote different STIM1 mutants (see text) normalized to Imax of model WT. The number of Orai1 entered into the model are noted below. E, number of channels with different occupancies plotted against S1/O1 ratio. F, number of OS4-bound channels for the different mutants plotted against S1/O1 ratio.

