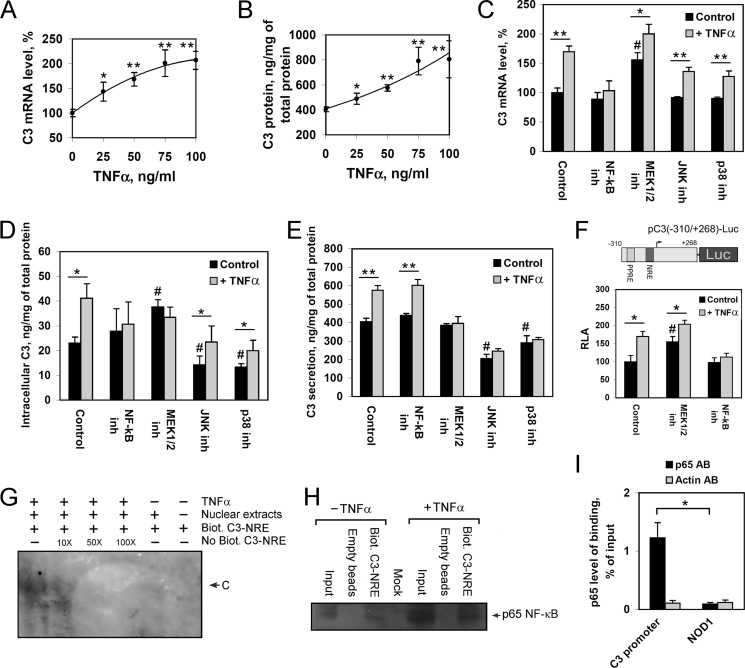
FIGURE 3.
The role of NF-κB and MAPKs in TNFα-mediated activation of C3 gene expression and protein secretion by HepG2 cells. A and B, levels of C3 mRNA (A) or secreted C3 protein (B) in HepG2 cells treated with various concentrations of TNFα for 24 h; 100% is the level of C3 mRNA in HepG2 cells untreated with TNFα. C–E, levels of C3 mRNA (C), intracellular (D), or secreted C3 protein (E) in HepG2 cells. F, luciferase assay of pC3(−310/+268)-Luc plasmid transfected into HepG2 cells. RLA, relative luciferase activity, 100% in control HepG2 cells. HepG2 cells were treated with/without TNFα (50 ng/ml, 24 h) and NF-κB inh, QNZ (NF-κB inhibitor) (10 nm); MEK1/2 inh, U0126 (MEK1/2 inhibitor) (10 μm); JNK inh, JNK inhibitor II (JNK1/2/3 inhibitor) (10 μm); or p38 inh, SB203580 (p38 inhibitor) (12.5 μm). Black bars correspond to TNFα-untreated cells; gray bars correspond to TNFα-treated cells. Values are presented as means ± S.E. (error bars) of six independent experiments. The statistical analyses of differences between compared groups were performed using an unpaired Student's t test (*, p < 0.05; **, p < 0.01) or Dunnett's criterion (#, p < 0.05). G, electrophoretic mobility shift assay of nuclear extract proteins of TNFα-treated or untreated HepG2 cells with NF-κB response element (NRE); Biot., biotin-labeled; No Biot., biotin-unlabeled probe containing C3-NRE and flanking regions. 10X, 50X, and 100X show the ratio of excess of unlabeled probe; C indicates DNA-protein complex. H, DNA affinity precipitation assay using nuclear extract proteins of TNFα-treated or untreated HepG2 cells and biotin-labeled probe containing C3-NRE followed by Western blot analysis of precipitated proteins using antibodies against p65. I, ChIP assay with HepG2 cells via real time PCR calculation. Levels of binding of p65 with the human C3 promoter and NOD1 gene (negative control) are shown for chromatin precipitates with antibodies against p65 (p65 AB) or β-actin (Actin AB). Values are presented as means ± S.E. (error bars) of four independent experiments. The statistical analyses of differences between compared groups were performed using an unpaired Student's t test (*, p < 0.05).

