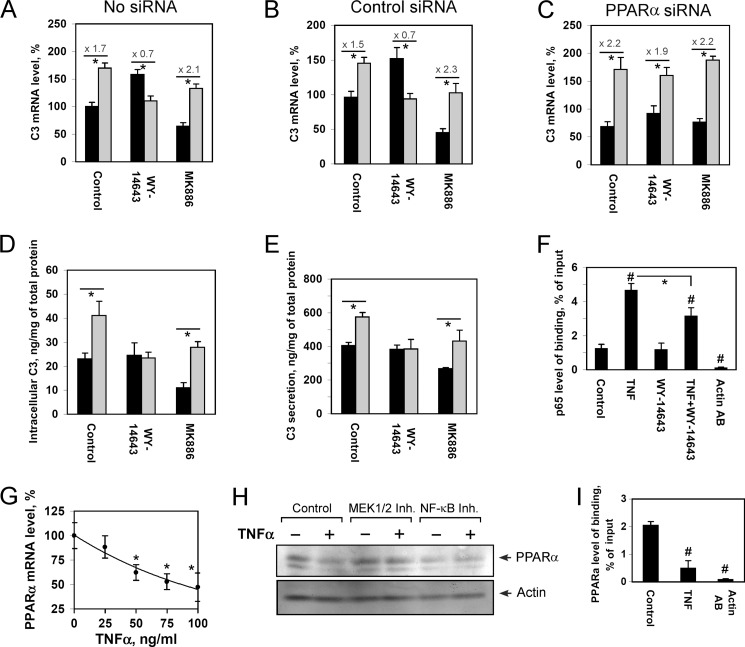
FIGURE 4.
WY-14643 inhibits TNFα-mediated up-regulation of C3 gene in a PPARα-dependent manner. A–C, levels of C3 mRNA in control (A), treated with control siRNA (B), or PPARa siRNA (C) HepG2 cells; 100% is the level in control HepG2 cells; levels of activation of C3 gene by TNFα are shown. D and E, intracellular (D) and secreted (E) C3 protein in HepG2 cells. HepG2 cells were treated with WY-14643 (10 μm) or MK886 (10 μm) and/or TNFα (50 ng/ml, 24h). Black bars correspond to TNFα-untreated cells; gray bars correspond to TNFα-treated cells. Values are presented as means ± S.E. (error bars) of four independent experiments. The statistical analyses of differences between compared groups were performed using an unpaired Student's t test (*, p < 0.05). F, ChIP assay with HepG2 cells treated with TNFα and/or WY-14643 via real time PCR calculation. Levels of binding of p65 with the human C3 promoter and NOD1 gene (negative control) are shown for chromatin precipitates with antibodies against p65 (p65 AB) or β-actin (Actin AB). Values are presented as means ± S.E. (error bars) of four independent experiments. The statistical analyses of differences between compared groups were performed using an unpaired Student's t test (*, p < 0.05) or Dunnett's criterion (#, p < 0.05). G, the level of PPARα mRNA in HepG2 cells treated with various concentration of TNFα for 24 h; 100% is the level in TNFα-untreated HepG2 cells. H, Western-blot analysis of PPARα protein content in HepG2 cells, treated with/without TNFα (50 μg/ml) and/or QNZ (10 nm NF-κB inhibitor; NF-κB inh); U0126 (10 μm MEK1/2 inhibitor; MEK1/2 inh) for 24 h. I, ChIP assay with HepG2 cells treated with/without TNFα via real time PCR calculation. Levels of binding of PPARα with the human C3 promoter are shown for chromatin precipitates with antibodies against PPARα (for control and TNF) or β-actin (for Actin AB). Values are presented as means ± S.E. (error bars) of four independent experiments. The statistical analyses of differences between compared groups were performed using an unpaired Student's t test (*, p < 0.05) or Dunnett's criterion (#, p < 0.05).

