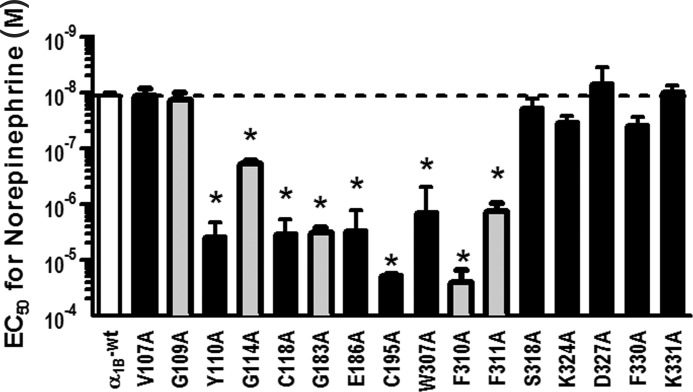
FIGURE 4.
Comparison of NE EC50 values for α1B-AR mutants measuring IP1 accumulation in response to increasing concentrations of NE. Mutants affecting both prazosin and ρ-TIA binding are cross-hatched, and mutants affecting only ρ-TIA affinity are black bars. Values are means ± S.E. of 35 separate experiments for WT and 3–5 separate experiments for the mutants, each performed in triplicate. Results for mutant W307A, which had no detectable prazosin binding, are also shown (n = 2). *, values of p < 0.05 were considered significant.

