FIGURE 2.
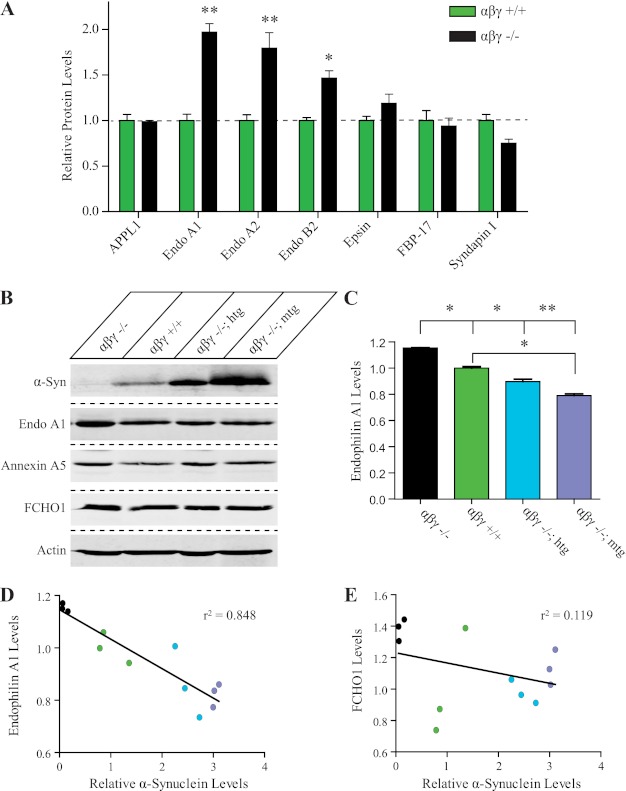
Proteomic analysis reveals that synucleins and endophilin A1 levels are inversely related. A, validation of endophilin levels by quantitative immunoblotting. Wild type (green bar) and αβγ-synuclein KO (black bar; n = 4/genotype) brain homogenates (20 μg protein) were separated on SDS-PAGE gels and immunoblotted for the denoted proteins. The levels of individual proteins were determined by quantitative Western blotting with IRDye conjugated secondary antibodies on a LI-COR infrared imaging system, using actin and tubulin as internal loading controls. Abbreviations: Endo, endophilin; *, p < 0.05, **, p < 0.01. B, representative Western blot of synaptic protein expression of endophilin A1, annexin A5, and FCHO1 in age-matched αβγ-synuclein KO (αβγ −/−), wild type (αβγ +/+), transgenic human (αβγ −/−; htg) and mouse (αβγ −/−; mtg) α-synuclein overexpression mouse models (n = 3/genotype). Actin is used as a loading control. C, quantification of endophilin A1 levels in αβγ-synuclein KO, wild type, and α-synuclein overexpression mouse models. *, p < 0.05, **, p < 0.01. D, comparison of synaptic protein expression shows an inverse relationship between α-synuclein and endophilin A1 levels. r2 = 0.848. See supplemental Fig. S2 for a similar analysis using total brain homogenates. E, levels of FCHO1 are unchanged as a function of α-synuclein levels. r2 = 0.119.

