
FIGURE 3.
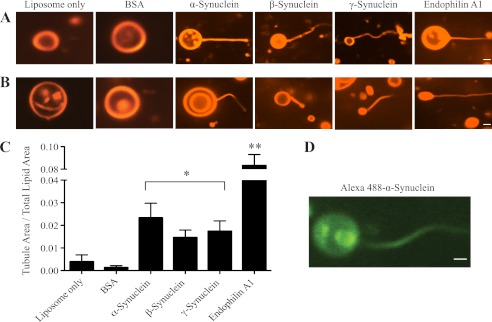
All synucleins generate membrane curvature in vitro. Images of liposomes only and liposomes mixed with BSA, α-, β-, γ-synuclein and endophilin A1. Tubules were generated by α-, β-, γ-synucleins and endophilin A1 (1.4 μm) from rhodamine-labeled liposomes composed of either: A, 50% DOPE/40% DOPS/10% cholesterol (1 mg/ml) or B, brain polar lipid (BPL; 1 mg/ml). Scale bar = 1 μm and applies to all images in a given row. C, quantification of tubulation activity, as measured by the ratio of tubule area to total lipid area for BSA, synucleins, and endophilin A1 using BPL-derived liposomes. BSA and endophilin A1 were used as negative and positive controls, respectively. Liposome-only and synuclein ratios are calculated from 900 images each, BSA and endophilin A1 from 540 images each; *, p < 0.05; **, p < 0.01 for comparisons to the liposomes only condition. D, Alexa-fluor 488-labeled α-synuclein localizes on the membrane tubules generated. Scale bar = 1 μm.