FIGURE 1.
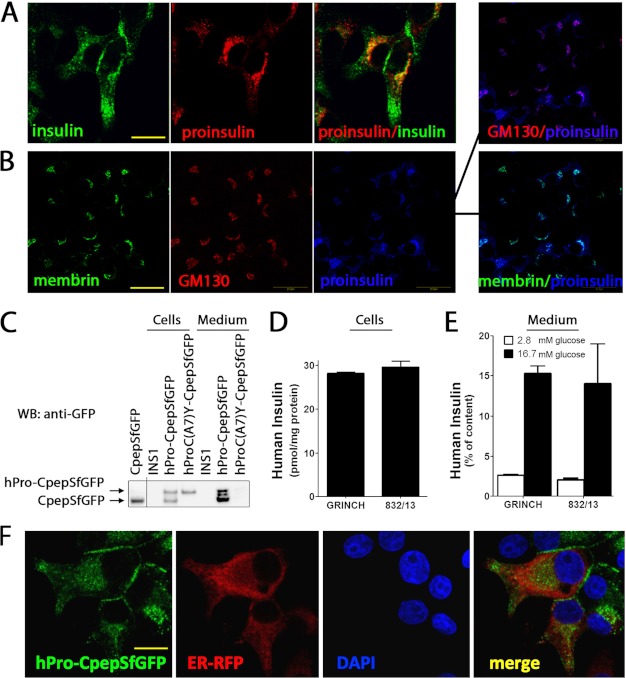
Expression of endogenous proinsulin and hPro-CpepSfGFP in INS1 cells. A, parental INS1 cells were processed for double-label immunofluorescence with guinea pig anti-insulin that cross-reacts with proinsulin (green) and mouse mAb anti-proinsulin that does not cross-react with insulin (red; a merged image is also shown, right panel). Confocal microscopy, scale bar = 10 μm. B, parental INS1 cells were processed for triple-label immunofluorescence with rabbit polyclonal anti-membrin (an ER-to-Golgi SNARE protein, green), Alexa Fluor 555-conjugated mouse anti-GM130 (a Golgi matrix protein, red), and a mouse mAb anti-proinsulin that does not cross-react with insulin (blue). A merged pairwise image is also shown (right panel). Scale bar = 20 μm. C, parental INS1 cells or GRINCH cells (INS1 cells stably expressing hPro-CpepSfGFP) or INS cells expressing hProC(A7)Y-CpepSfGFP were plated in 12-well plates. The bathing media were collected after 18 h, and the cells were lysed. All samples were then resolved by reducing SDS-PAGE in 4–12% acrylamide gradient gels and electrotransfer to nitrocellulose for direct immunoblotting (WB) with anti-GFP. Note that hPro-CpepSfGFP shows processing to CpepSfGFP (a recombinant CpepSfGFP standard is shown at the left) as well as extensive secretion. Human insulin content (D) and insulin secretion (E) after unstimulated (2.8 mm glucose, open bars) and stimulated (16.7 mm glucose, closed bars) collections from GRINCH and INS832/13 (832/13) cells. Human insulin RIA is specific for processed, mature, human insulin, and this comprises 6–8% of total proinsulin + insulin of all species in GRINCH and 832/13 cells. Data from three independent measurements are shown. Data are mean ± S.D. F, GRINCH cells were transiently transfected to express an ER-targeted RFP-KDEL (ER-RFP). Note that hPro-CpepSfGFP (green) exhibits a dual distribution in the juxtanuclear region as well as in cell processes and subjacent to the cell membrane. Neither of these distributions matches that of ER-RFP (red). Both DAPI nuclear staining and a merged image are shown. Scale bar = 10 μm.

