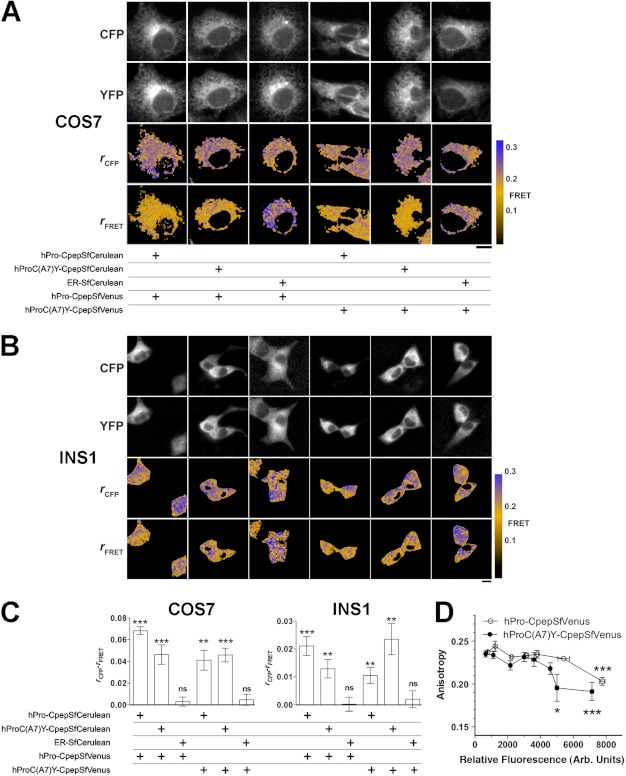
FIGURE 8.
Interactions of hPro-Cpep and hProC(A7)Y-Cpep in living cells as determined by FRET. A and B, hPro-Cpep and hProC(A7)Y-Cpep fusions with SfCerulean and SfVenus were cotransfected into COS7 (A) and INS1 cells (B) in the indicated combinations along with ER-localized control protein. Cells were observed by fluorescence polarization microscopy 6 h post-transfection for COS7 cells and 24 h post-transfection for Ins1 cells. The top two rows of images display cyan (CFP) and yellow fluorescence (YFP), and the bottom two rows display the calculated anisotropies (r) for the CFP and FRET images (cyan excitation, yellow emission). Reduction in the FRET channel anisotropy (orange) relative to the cyan anisotropy indicates FRET. Non-cellular regions in the anisotropy images were masked for clarity (black). Scale bar = 10 μm. C, the difference between fluorescence anisotropies in CFP and FRET channels was calculated from image data obtained in COS7 and INS1 cells. Significant FRET was observed between homotypic and heterotypic expression of proinsulin constructs in both cell types but not when either construct was coexpressed with an ER-localized control plasmid. n = 10 cells per group; *, p < 0.05, **, p < 0.01; ***, p < 0.001, Student's t test versus 0. D, to look at the relative strength of protein-protein interactions between hPro-CpepSfVenus or hProC(A7)Y-CpepSfVenus homotypic pairs, fusion protein overexpression was achieved in COS7 cells by waiting 17 h post-transfection. Homotransfer FRET is indicated by a reduction in SfVenus anisotropy and was observed with less relative fluorescence (expressed in arbitrary units) for hProC(A7)Y-CpepSfVenus compared with hPro-Cpep-SfVenus, consistent with an increased affinity (analysis of variance, Tukey multiple comparison test versus lowest detectable expression, n ≥ 3 cells for each point. *, p < 0.05; ***, p < 0.001). Bars indicate mean ± S.E. for B and C.

