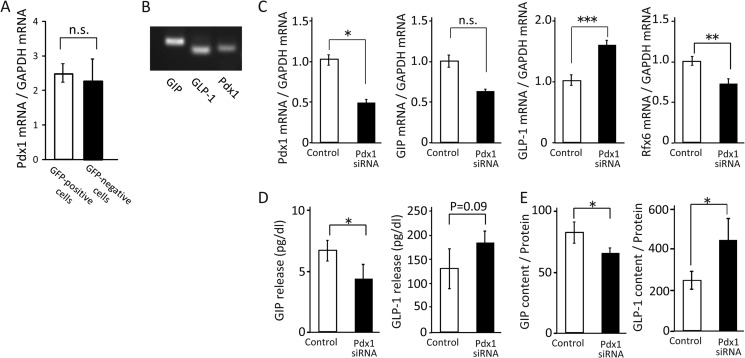
FIGURE 3.
Effect of Pdx1 on mRNA expression, cellular content, and secretion of GIP. A, Pdx1 mRNA levels in GFP-positive cells and GFP-negative cells (n = 8–10). B, GIP, GLP-1, and Pdx1 mRNA expressions in STC-1 cells by RT-PCR. C, Pdx1, GIP, GLP-1, and Rfx6 mRNA levels in Pdx1 knockdown STC-1 cells (n = 4). D and E, incretin content and secretion in Pdx1 knockdown STC-1 cells (n = 4). *, p ≤ 0.05; **, p ≤ 0.01; ***, p < 0.001, n.s., not significant.

