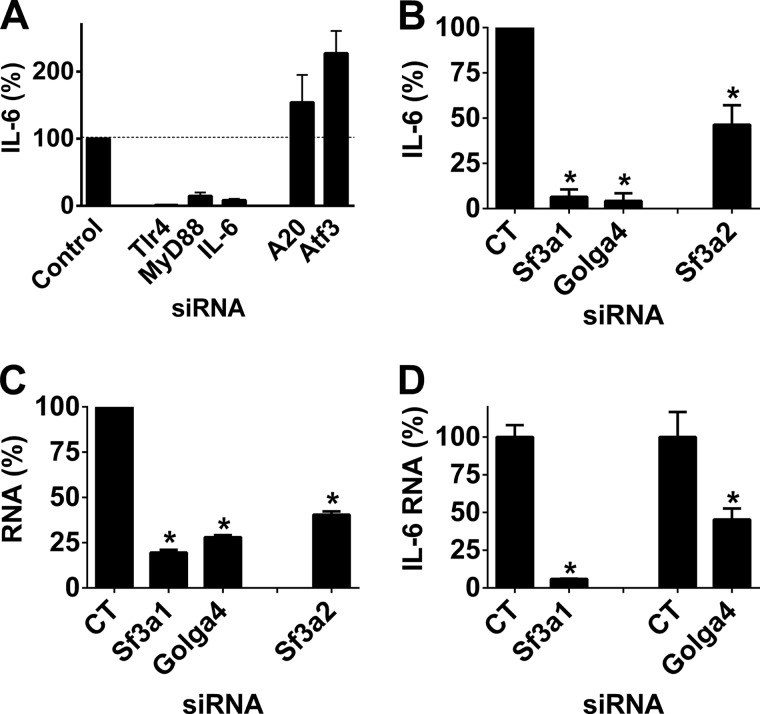
FIGURE 4.
Confirmation that SF3A1 and GOLGA4 regulate LPS-induced IL-6 production using a second mouse macrophage cell line. A and B, indicated pools of siRNA duplexes were transfected into the RAW264.7 mouse macrophage cell line; cells were simulated with LPS (20 ng/ml for 6 h), and IL-6 production in cell supernatants was monitored by ELISA. C depicts the results of qPCR, which was used to monitor RNA knockdown of the indicated genes in B. D, indicated pools of siRNA duplexes were transfected into the RAW264.7 mouse macrophage cell line; cells were stimulated with LPS (20 ng/ml for 6 h), and IL-6 RNA production was monitored by qPCR. Asterisks indicate siRNA treatments that induced IL-6 protein levels (B), gene knockdown (C), or IL-6 RNA levels (D) that were statistically different from the controls (p < 0.05).

