
FIGURE 1.
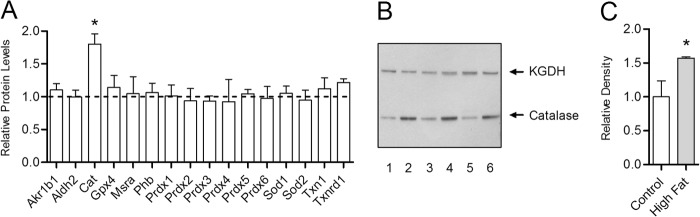
Antioxidant network response to a high fat diet within the heart is specific to catalase. The relative difference in protein expression between high fat and low fat fed control mice was determined for enzymes of the cardiac antioxidant network by quantitative mass spectrometry with selected reaction monitoring. A, antioxidant protein expression in mice fed a high fat diet for 30 weeks relative to low fat fed controls (dashed line). The abbreviations used are aldo-keto reductase family 1 Member B1 (Akr1b1), aldehyde dehydrogenase (Aldh2), catalase (Cat), glutathione peroxidase (Gpx), methionine sulfoxide reductase A (Mrsa), prohibitin (Phb), peroxiredoxin (Prdx), superoxide dismutase (Sod), thioredoxin (Txn), and thioredoxin reductase (Txnrd). Values are presented as the mean ± S.D. (n = 5), where * indicates a significant increase (2-tailed t test) in high fat-fed mice versus low fat-fed controls (p < 0.05). B, Western blot analysis of whole heart lysates from mice fed high fat diet (lanes 2, 4, and 6) or low fat control diet (lanes 1, 3, and 5) for 30 weeks with antibodies for catalase and the E1 subunit of α-ketoglutarate dehydrogenase (KGDH), which served as a loading control. C, densitometry analysis of catalase Western blot band intensities in mice fed high fat diet for 30 weeks (closed bar) relative to low fat-fed controls (open bar).