
FIGURE 3.
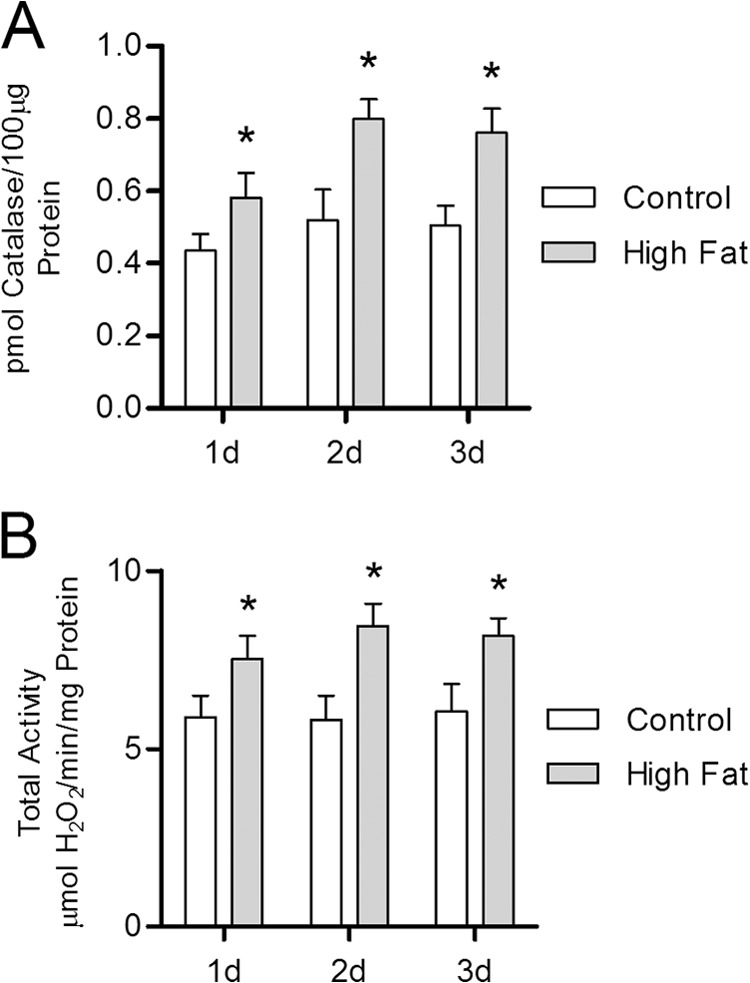
Catalase induction is immediately responsive to high fat feeding. Catalase protein concentration and activity were determined by quantitative mass spectrometry and measuring the rate of H2O2 clearance via absorbance spectrophotometry, respectively, within whole heart lysates from mice maintained on either high fat or low fat control diet for 1–3 days (d). A, catalase protein concentration in whole heart lysates from high fat-fed mice (closed bars) relative to low fat-fed controls (open bars). B, total catalase activity (H2O2 consumed per mg of total protein) in high fat-fed mice compared with low fat-fed controls. Values are presented as the mean ± S.D. (n ≥5), where * indicates a significant increase (2-tailed t test) in high fat-fed mice versus low fat-fed controls within each diet duration (p < 0.01).