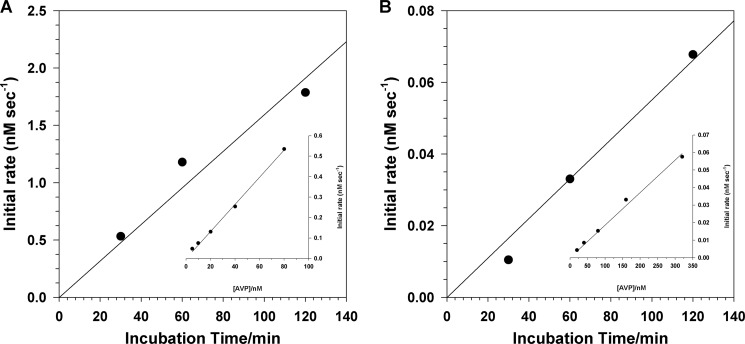
FIGURE 6.
pVIc forms a disulfide bond with the AVP molecule that cut it out. A reaction mixture was set up in buffer B containing 0.77 μm pVI, 1.3 μm AVP, and 0.67 μm 36-mer dsDNA. After the indicated time intervals, 55-μl aliquots were removed and added to 55 μl of either 5 μm (Cbz-Leu-Arg-Gly-Gly-NH)2-rhodamine in buffer B containing 0.67 μm 36-mer dsDNA (A) or 5 μm (Cbz-Leu-Arg-Gly-Gly-NH)2-rhodamine in buffer B but with 0.5 m NaCl (B). The rates of substrate hydrolysis were measured over a 30-min period. The insets are standard curves relating the initial rate as a function of time versus molar concentration of AVP-pVIc complexes bound to DNA (A) and AVP-pVIc complexes not bound to DNA (B). In the inset for A, the reactions in buffer B contained the indicated concentrations of AVP plus 20 μm pVIc, 0.67 μm 36-mer dsDNA, and 5 μm (Cbz-Leu-Arg-Gly-Gly-NH)2-rhodamine. In the inset for B, the reaction in buffer B with 250 mm NaCl contained 5 μm (Cbz-Leu-Arg-Gly-Gly-NH)2-rhodamine.

