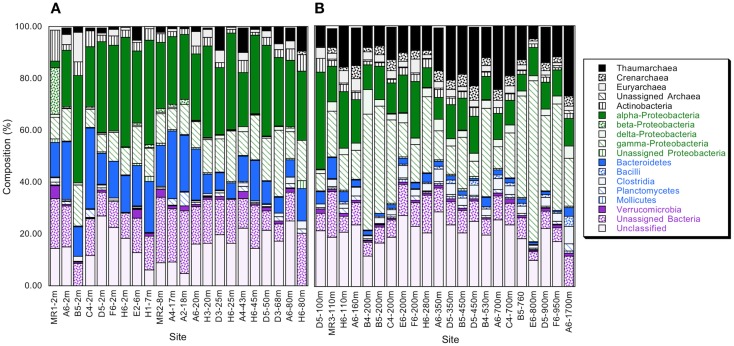
Figure 1.
(A) Relative abundance of phyla and classes for bacterioplankton samples obtained from depths ≤100 m as determined from PANGEA analysis, excluding chloroplast, and cyanobacterial sequences; minor phyla and classes represented by sequences accounting for ≤0.1% of the total for each sample are not shown. (B) As for (A), but data are for samples from >100 m. Station positions are mapped in Figure A1 in Appendix.

