Figure 3.
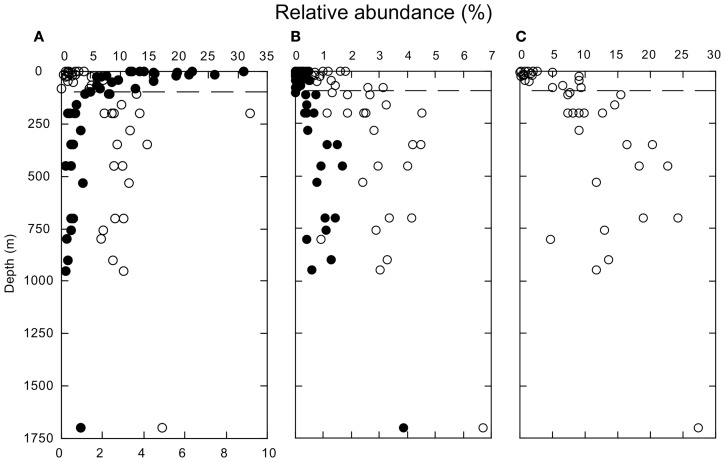
(A) Depth profiles of the relative abundances of Bacteroidetes (closed symbols) and δ-Proteobacteria (open symbols). (B) Depth profiles of the relative abundances of Bacilli (closed symbols) and Clostridia (open symbols). (C) Depth profiles of the relative abundances of Thaumarchaeota. All identifications based on PANGEA analysis. The dashed line indicates a depth of 100 m.

