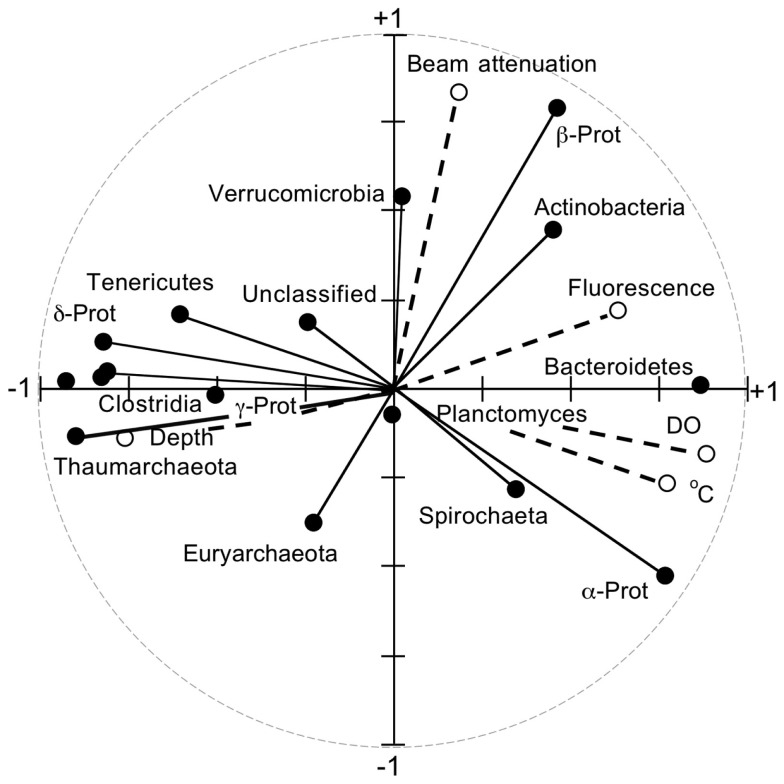
Figure 6.
Results from a canonical correlation analysis using relative abundances of phyla and classes (e.g., as in Figure 1) as determined by PANGEA, and salinity, pH, depth, dissolved oxygen, fluorescence (a measure of chlorophyll concentration), and beam attenuation (a measure of particle content) for each sample.

