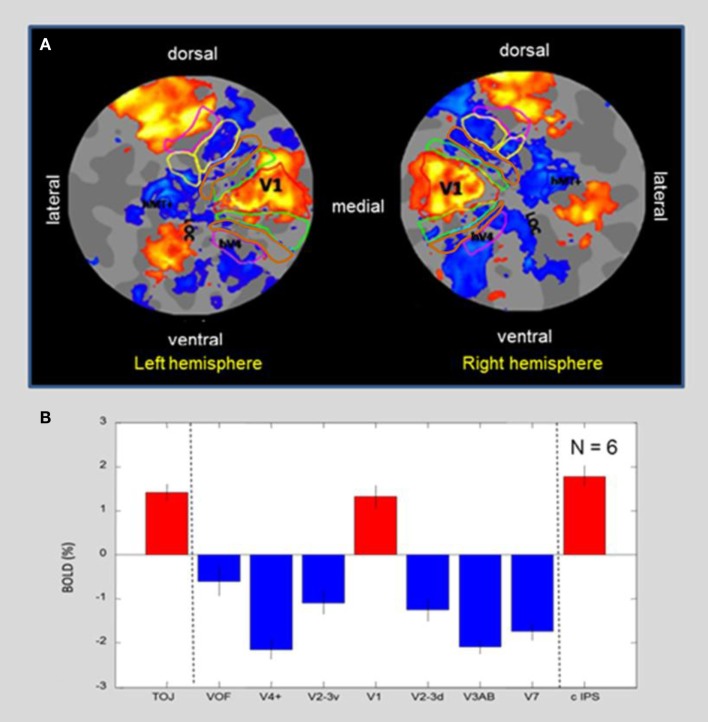
Figure 5.
(A) MD flat-maps centered on the occipital pole. ROIs for the retinotopic hierarchy are indicated by colored outlines, with hMT+ and LOC based on functional localizers. The post-training MD map shows a “triad” of three activation regions (orange-yellow coloration). Note in particular that the (non-stimulated visually) primary visual cortex, V1, forms an unusual isolated “island” of activation surrounded by a “sea” of suppression in the adjacent retinotopic areas. The other two activated regions seen on the flat map are the caudal intraparietal sulcus (cIPS) dorsally and an additional locus at the occipitotemporal border (LOtv). (B) Average response amplitude with standard errors for blindfolded memory-guided drawing in a group of six subjects, showing positive signal in the triad of areas – primary visual area V1, cIPS, and LOtv; these three “islands” of positive activation are separated by strong deactivation in both the ventral and the dorsal extrastriate areas. Error bars represent 1 standard error of the means.

