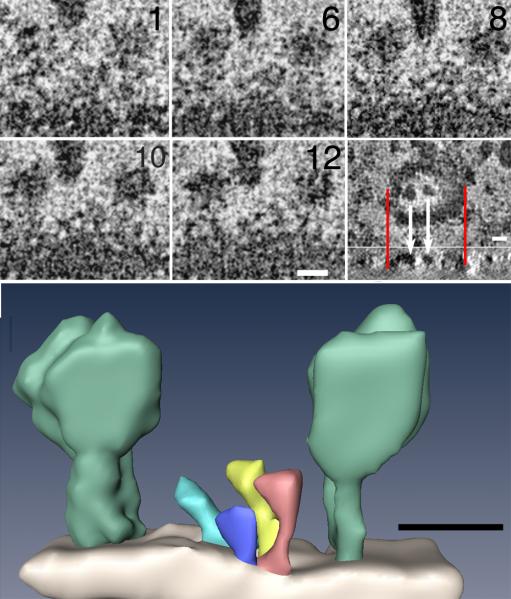
Figure 3.
(A) Five virtual sections, each 0.6 nm thick, extracted from different levels in a tomogram of a single negative stained synaptic vesicle. The external surface of the vesicle displays three prominent molecules (arrow). Synaptic vesicles collapse during negative staining, leaving other prominent molecules (arrowhead) on their collapsed external surfaces exposed to negative stain. Data have been adjusted for brightness and contrast, binned by two and spatially filtered to increase the signal-to-noise (S/N). Inset (lower right panel): Virtual section through vesicle in en-face plane showing how two large surface particles (white arrows) aligned with a cross sectional projection below. Red lines delineate two edges of vesicle above and the same edges below. Surface particles lie in a plane defined by the two edges of the vesicle, showing that the vesicle is flattened onto the substrate (below). (Scale bar = 10 nm). (B) Corresponding surface rendering of structures on the surface of the vesicle in A, including two of the more prominent ones (light green) whose sizes and shapes correspond to EM reconstructions of the V-ATPase of T. Thermophilus (Bernal and Stock, 2004). Smaller structures (other colors) are also evident on the surface of the vesicle. (Scale bar = 10 nm).

