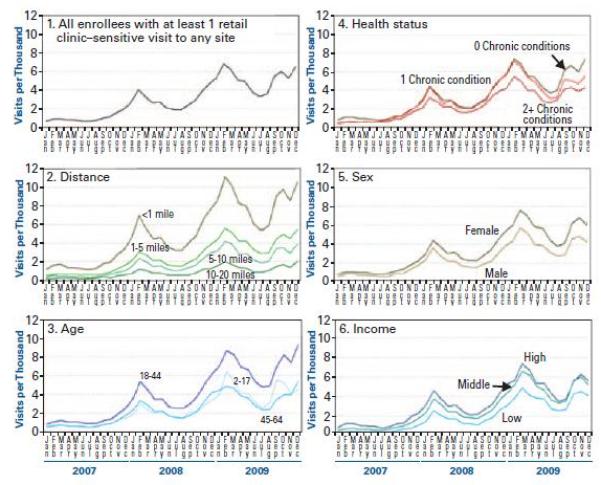
Figure. Monthly Rate of Retail clinic Use 2007 to 2009 Among Subsets of the Enrollee Populationa.

aFigure presents unadjusted monthly utilization of retail clinics for acute conditions among the population of all enrollees who had a visit for a retail clinic-sensitive condition leg. sinusitis, pharyngitis) at any point in 2007 to 2009. A full list of conditions is provided in the text (Methods. Focus on Acute Care Visits). Panel 1 focuses on all enrollees. Panels 2 to 6 divide the population into different groups. Panel 2 divides the enrollees based on the distance from their residence to the nearest retail clinic. Panel 3 divides the nonelderly population by age. Patients aged <2 and >65 years were excluded from the study. Panel 4 divides the population by the presence of chronic illnesses. A description of measures is provided in the Methods. Predictors of Retail Clinic Use section of this article. Panel 5 divides the population by sex. Panel 6 divides the population by income (low: >2 times the federal poverty level; middle: >2 times the federal poverty level to $59,000: high: ≥$59,000).
