
Figure 3.
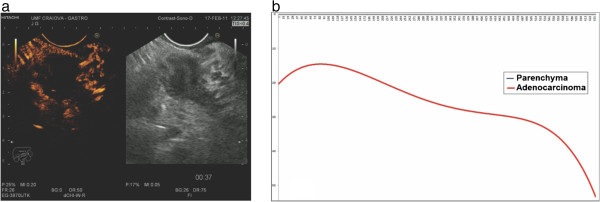
Example of CEH-EUS and TIC of pancreatic adenocarcinoma. (a) Pancreatic adenocarcinoma. (b) Graphical representation of the TIC trend line for the ROI corresponding to the tumor referenced to the parenchyma baseline.
Official websites use .gov
A
.gov website belongs to an official
government organization in the United States.
Secure .gov websites use HTTPS
A lock (
) or https:// means you've safely
connected to the .gov website. Share sensitive
information only on official, secure websites.
Example of CEH-EUS and TIC of pancreatic adenocarcinoma. (a) Pancreatic adenocarcinoma. (b) Graphical representation of the TIC trend line for the ROI corresponding to the tumor referenced to the parenchyma baseline.