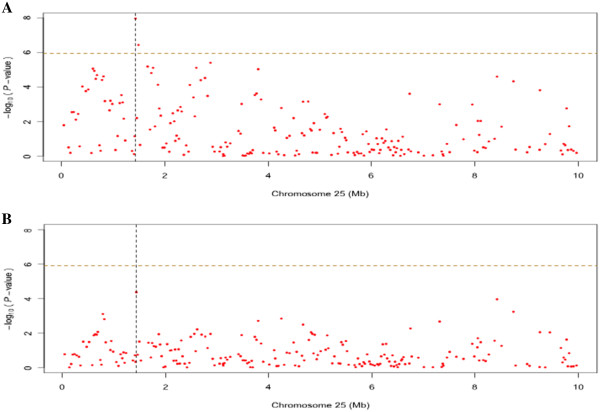
Figure 3.
The association of protein yield to BTA25 with and without stature as a covariate. The p-values for the association of protein yield to BTA25 was obtained using a linear mixed model and genomic control and then transformed to –log10 (P-values). The horizontal dashed line indicates the genome-wide significance level (i.e. corrected for testing all markers on BTA1-29). Figure 3A shows the result of the analysis without and 3B the analysis with the stature phenotype as a covariate in the linear model.

