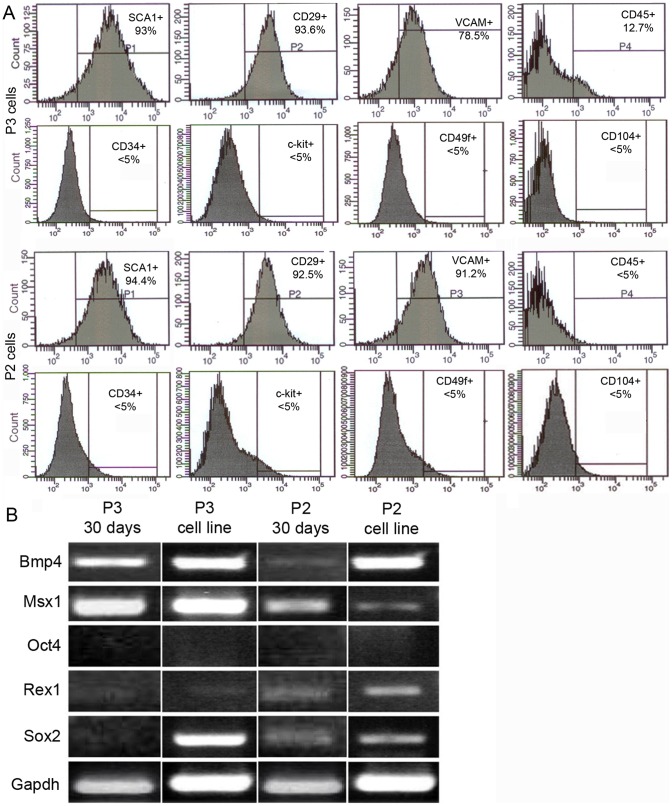
Figure 2. Flow cytometric profiling and RT-PCR analysis of P2 and P3 cells.
A) Flow cytometry analysis identify a similar signature for P2 (bottom panels) and P3 cells (top panels). Analyses were performed in series on the same samples, P1-P4 denote the order of the measurements. In the scatter plots, both cell lines are positive with a single peak for Sca-1, CD29, V-CAM and negative for CD45, C-kit, CD49f, CD104 and CD34. This signature is similar to other characterized MSC lines. B) RT-PCR results from both P3 and P2 cells expanded for 30 days compared with established cell lines. Digit regeneration marker genes Bmp4 and Msx1 are stably expressed in P3 cells and variably expressed in P2 cells. Stem cell marker genes are differentially expressed in P2 and P3 cells. Oct4 is not expressed in P2 and P3 cells. Rex1 is minimally expressed in P2 and P3 cells. Sox2 is minimally expressed in P2 cells and in early passage P3 cells but strongly expressed in the P3 cell line.

