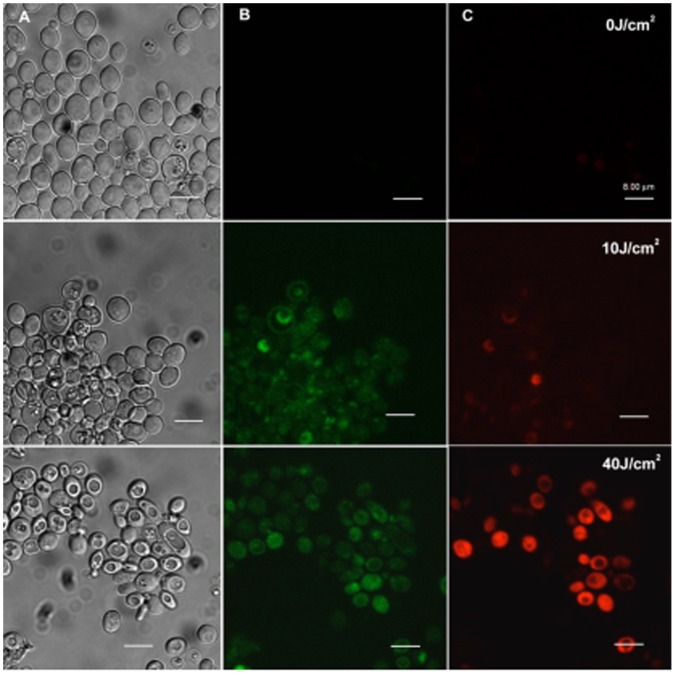
Figure 7. Confocal microscopy image of C. neoformas KN99α.
Cells were treated with APDI mediated by pL-ce6 (10 µM) and then incubated with FITC-annexin V and PI. Green represents fluorescence of externalized phosphatidylserine that is correlated to the initial steps of apoptosis, and red corresponds to fluorescence of PI (advanced apoptosis/necrosis). We present three pictures of the same field: Transmittance in column A, green and red fluorescence in columns B and C respectively. The first line of figures is the stained samples before APDI (0J/cm2), the second line is following an irradiation of 10J/cm2 and the last one was irradiated with fluence of 40J/cm2. Scale bars 8µm.

